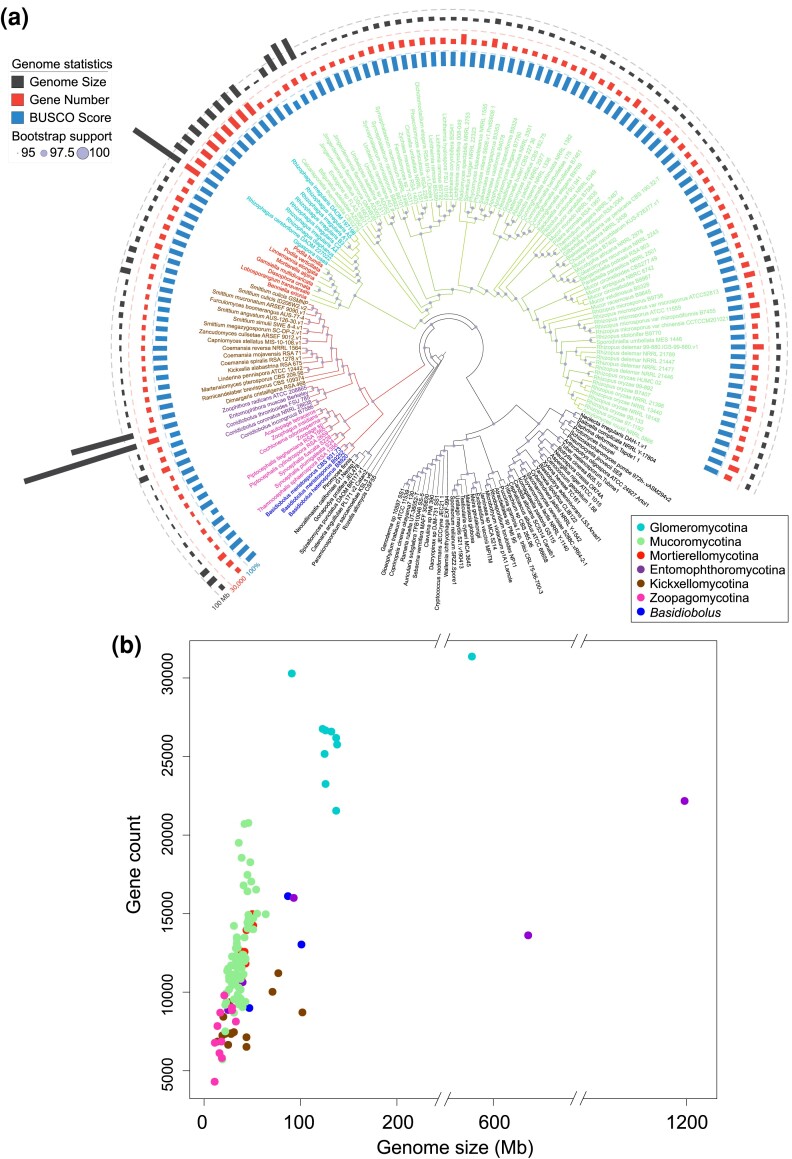
Fig. 1.
Phylogenetic relationships and genome statistics of zygomycete fungi. (a) The maximum-likelihood tree was inferred from a phylogenomic data set of 617 protein sequences identified in the included 181 genomes. Branches of Mucoromycota and Zoopagomycota were colored in green and red separately, while tip labels were in the color scheme according to the subphyla information. The bootstrap supports are indicated on each node relatively. Tracks from the inside to outside are mapped based on the BUSCO scores, protein-coding gene numbers, and genome size of included zygomycete fungi (detailed bootstrap values, concordance factors, and branch lengths are shown in supplementary fig. S1a, Supplementary Material online). (b) The density of protein-coding genes in each genome was plotted using genome sizes on the x-axis against the gene counts on the y-axis. Each dot was colored based on their phylogenetic placement shown in the legend.

