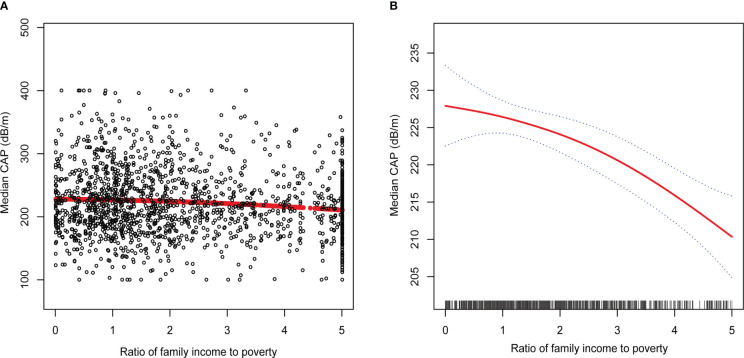
Figure 2.
The association between PIR and degree of hepatic steatosis. (A) Each black point represents a sample. (B) The solid red line represents the smooth curve fit between variables. Blue bands represent the 95% of confidence interval from the fit. Controlled Attenuation Parameter; Ratio of family income to poverty, PIR.

