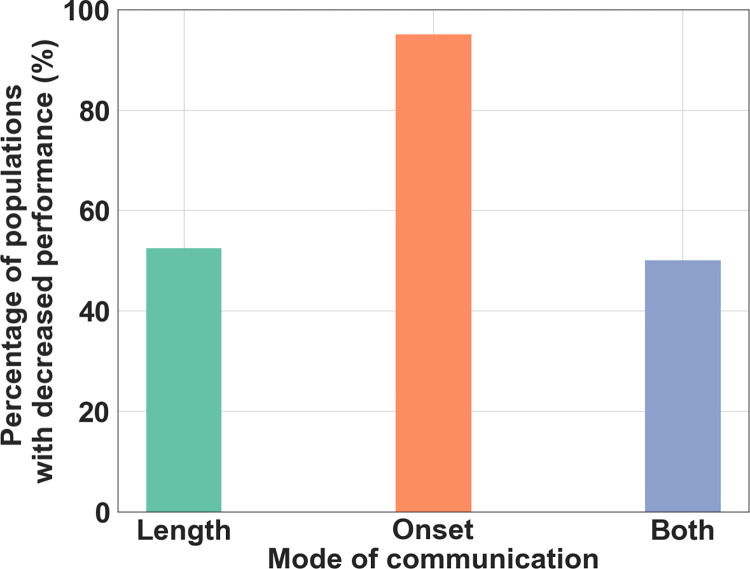
Fig 5. Percentage of populations with decreased performance depending on communication mode.
Percentage of the populations (n = 40) where performance was significantly (Mann-Whitney U test, P < 0.01) decreased by preventing receivers from using information on the timing of signal onset-delay and/or duration. Length (green bar) represents the percentage of populations where performance was decreased when constraining the signal duration. Onset (orange bar) represents the percentage of populations where performance was decreased when shifting signal onset-delay. Both (purple bar) represents the percentage of populations where performance was decreased when altering either the onset-delay or signal duration.

