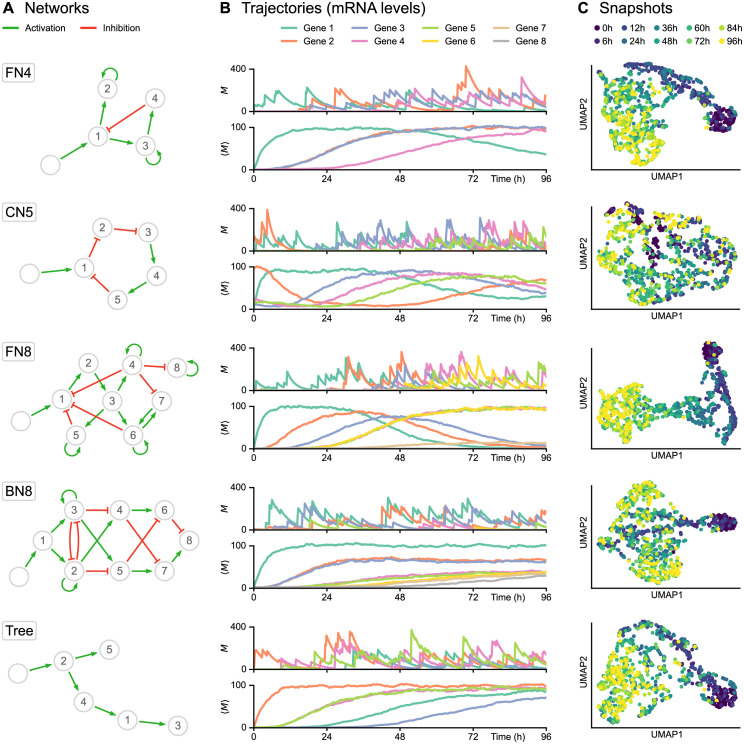
Fig 1. Single-cell data simulation using HARISSA.
(A) Networks used for subsequent tests, including feedback loop networks (FN), a cycling network (CN) and a branching network (BN). Genes and stimulus are represented by numbered nodes and an empty node, respectively, while green arrows indicate activation and red blunt arrows indicate inhibition. (B) Corresponding trajectories, defined as time-dependent mRNA levels (in copies per cell). For each network, the first plot shows one example of single-cell trajectory M while the second plot shows the population average 〈M〉 from 1000 cells. The transcriptional bursting model underlying HARISSA implies that every single-cell trajectory differs strongly from the more usual population average. (C) Two-dimensional UMAP representations of corresponding single-cell snapshots, defined as mRNA levels sampled at 10 timepoints in different cells from 0h to 96h, with 100 cells per timepoint. Such snapshots are called time-stamped data in the text and are fundamentally different from single-cell trajectories, which are currently not available experimentally.

