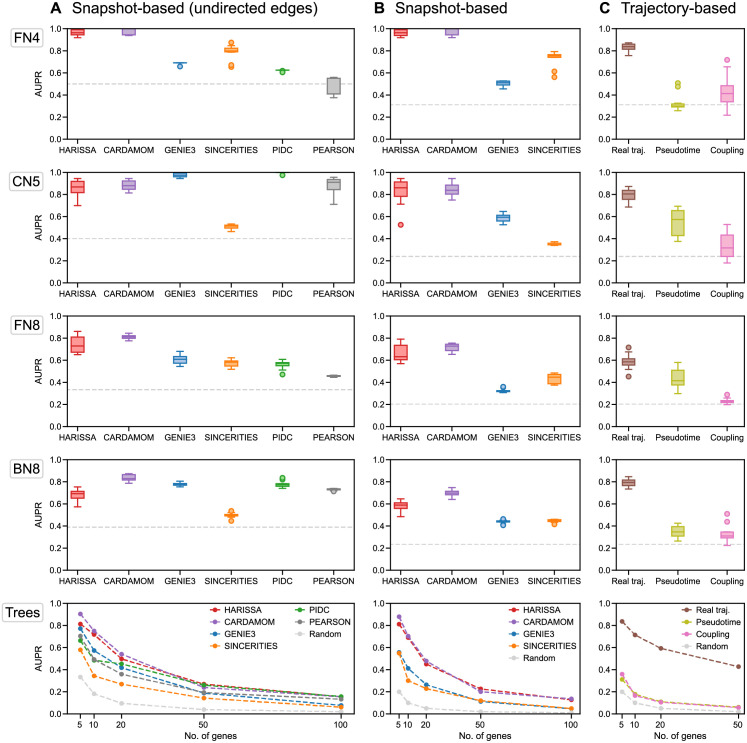
Fig 2. Benchmark of inference methods for five different network structures.
For each network, inference is performed on ten independently simulated datasets, each dataset containing the same 10 timepoints with 100 cells per timepoint (1000 cells sampled per dataset). The performance on each dataset is then measured as the area under the precision-recall curve (AUPR), based on the unsigned inferred weights of edges. Finally, the performance of each method is summarized as a box plot of the corresponding AUPR values, or the average AUPR value for the tree-structure activation networks (Trees). For each plot, the dashed gray line indicates the average performance of the random estimator (assigning to each edge a weight 0 or 1 with 0.5 probability). For the Trees networks, each dataset corresponds to a random tree structure of fixed size (5, 10, 20, 50, and 100 genes) sampled from the uniform distribution over trees of this size. (A) Performance of all methods when considering only undirected interactions. (B) Performance of the methods able to infer directed interactions. (C) Performance of the SCRIBE inference method for the same networks, in three conditions: when one has access to real single-cell trajectories (in brown), when pseudo-trajectories are reconstructed from time-stamped data using a coupling method similar to Waddington-OT (in pink), and when a single pseudo-trajectory is reconstructed using the pseudotime algorithm SLINGSHOT (in light green). For the last two conditions, the datasets used are therefore the same as those used for the other methods.

