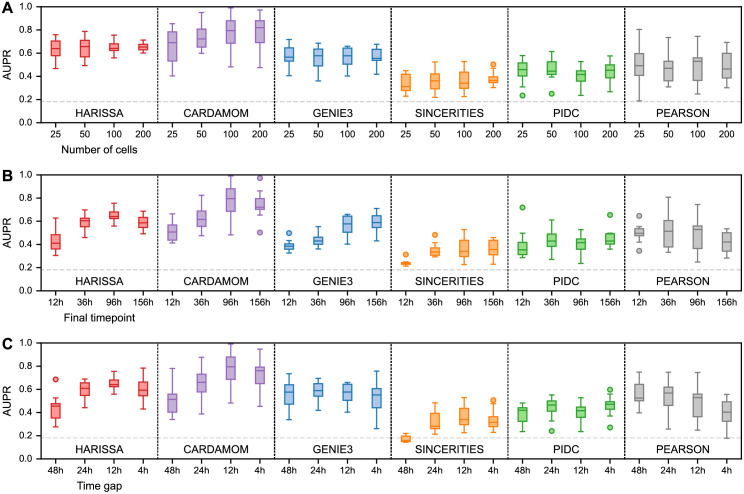
Fig 3. Dependence of inference methods on data collection parameters.
For simplicity, only the case of undirected interactions is considered here and the datasets are restricted to 10-gene tree-structure networks (see Fig 2 for the general benchmark). Inference is performed for each method and condition on ten independently simulated datasets and summarized by box plots of AUPR values as in Fig 2. For each plot, the dashed gray line indicates the average performance of the random estimator (assigning to each edge a weight 0 or 1 with 0.5 probability). (A) Performance as a function of the number of cells per timepoint, while keeping the same timepoints. (B) Performance as a function of the length of the measurement period, while keeping the same gap between timepoints and the same total number of cells. (C) Performance as a function of the gap between timepoints, while keeping the same final timepoint and the same total number of cells.

