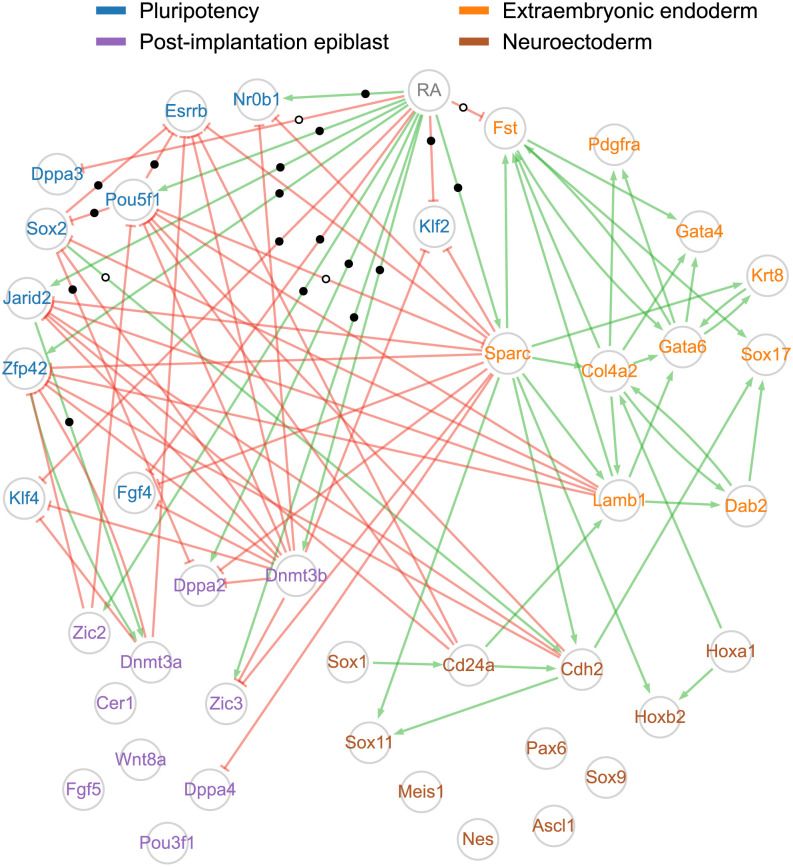
Fig 5. Network inferred by CARDAMOM from a real time-stamped scRNA-seq dataset.
The CARDAMOM inference method was applied to the experimental dataset from [22] restricted to a panel of 41 marker genes identified by the authors. The network structure is obtained by keeping only the 5% strongest activations (green arrows) and inhibitions (red blunt arrows) acting on each gene. Genes are colored according to four groups related to different cell states (pluripotency, post-implantation epiblast, neuroectoderm, extraembryonic endoderm) following the proposed classification of [22]. Edges supported by a ChIP-seq interaction are marked with black dots (see main text for the definition of what is considered as an interaction) and edges that are not supported are marked with white dots: this concerns only the edges starting from the RA stimulus, Pou5f1, Sox2, and Jarid2. Edges for which we have no reliable information have no mark.

