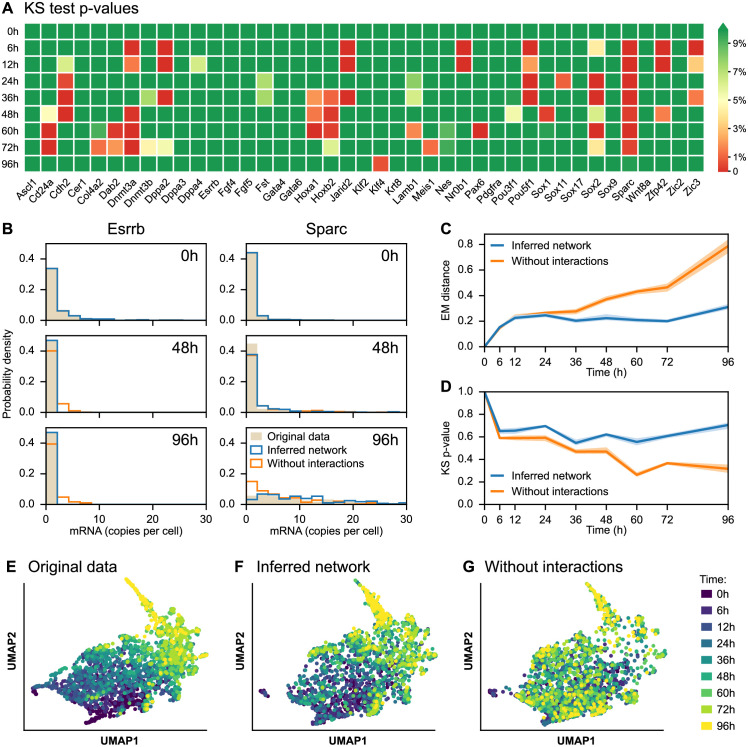
Fig 7. Inferred network simulations compared to the original dataset.
(A) Heatmap of p-values associated with Kolmogorov–Smirnov (KS) tests between real and simulated mRNA distributions, for each of the 41 genes of the network and for each timepoint. The green color indicates p-values greater than 5%, implying that the model output is not significantly different from the experimental dataset. (B) Time-dependent distributions of Esrrb and Sparc genes for the experimental dataset (original data, in beige) and datasets simulated after calibrating the mechanistic model, one including interactions (inferred network, in blue) and one obtained after removing interactions (without interactions, in orange). (C-D) Average earth’s mover (EM) distance (C) and average KS p-value (D) between real and simulated distributions, for the inferred network and without interactions. The dispersion corresponds to the first and ninth decile from ten simulations. (E-F-G) Two-dimensional UMAP representations of the original dataset (E) and the datasets simulated from the inferred network (F) and without interactions (G). In these three plots, Sparc is removed from the genes represented in Fig 5 as its dynamics are not well captured by the mechanistic model, so the three datasets consist of 2449 cells with mRNA levels of 40 genes.

