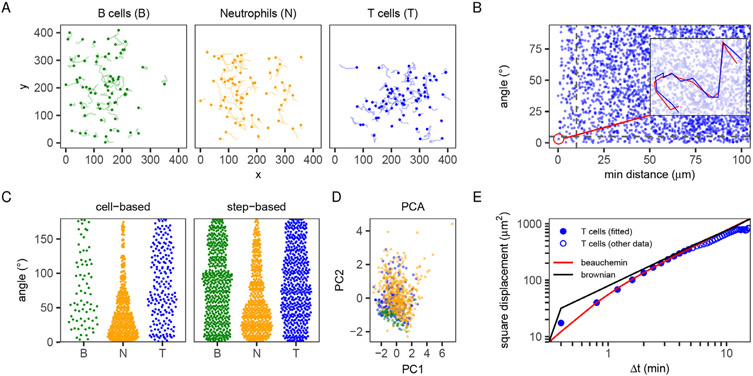
Fig. 2.
Example analysis of migration data of different immune cells. B cells and T cells were imaged in the cervical lymph node of a healthy mouse, neutrophils proximal to an S. aureus infection in the mouse ear. Data were preprocessed as described in Supplementary file 3; for full code, see Supplementary file 8. (A) Trajectories of the different datasets (for this example, 70 tracks per cell type were sampled randomly to avoid cluttered plots for larger data sets). (B) Angle analysis reveals a (simulated) double tracking error in the T-cell dataset. Each point is one pair of tracks, plotted as the minimum distance between them (at any point in time) versus the angle between their overall displacement vectors (from the beginning to the end of each track). The doubly tracked cell appears at low distance and angle; the corresponding track and its duplicate are shown in the inset (see also Supplementary file 2). (C) Cell-based and step-based angles to direction (1, −1) for the T cell (T), B cell (B), and neutrophil (N) datasets (see Supplementary file 4 for details). (D) Principal Component Analysis (PCA) based on multiple features (speed, mean turning angle, squared displacement, and outreach ratio; see Supplementary files 5 and 7) reveals which tracks have similar motility. Each point represents a track, and colors represent the dataset. (E) Comparison of the MSD of the T-cell dataset (blue circles) versus 2 fitted models (brownian motion and the Beauchemin model [9]). Only the solid blue points were used to fit on, since the empirical MSD at longer timescales is affected by the limited imaging window (an artifact); see Supplementary file 6 for details on fitting models.

