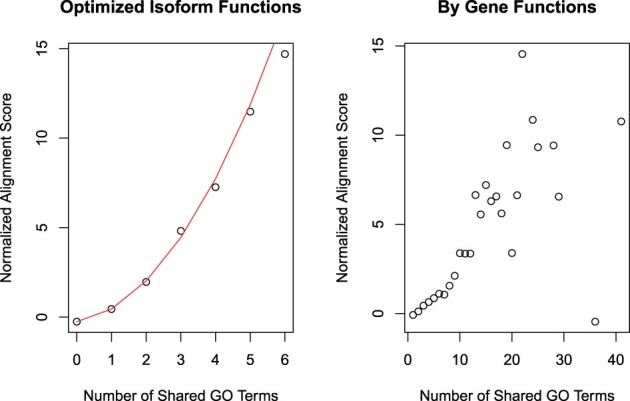
Figure 2.

Mean sequence alignment score as a function of the number of shared GO annotations. In order to alleviate the computational cost of the E-step of the EM algorithm, we repeatedly split the isoforms into 200 random subsets and run a GA in each subset for a fixed number of iterations. Here, for the last partition into 200 isoform sets, mean normalized sequence alignment scores were plotted against the number of GO terms shared by pairs of isoforms (left) and the number of GO terms shared by the pairs of genes that contain the isoforms (right). The red line in the left frame corresponds to the quadratic model [expressed in Equation (1) in the main text] using the final values. This figure was created with data generated by the inference of isoform-specific GO MF annotations
