
FIGURE 1.
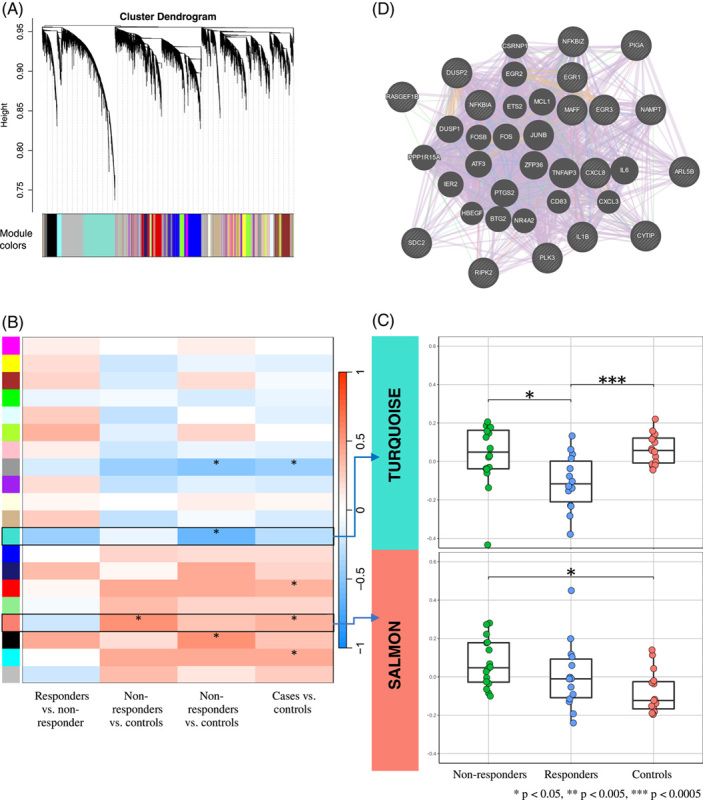
Weighted gene co-expression network analysis (WGCNA) of RNA-sequencing data from CD14 cells. (A) Dendrogram showing gene co-expression networks (‘modules’). (B) Heatmap showing the strength of correlation between each module (rows) and each trait (columns). Asterisks indicate that the module is associated with the trait at q<0.05, where q is the false discovery rate-adjusted p-value. Rows outlined in black identify modules with at least moderate correlation (r≥0.5) with 1 or more traits and enriched with Hallmark gene sets at q<0.05. (C) Boxplots of the module eigengenes (ie, the first principal component of gene expression in the module; y-axis) in each group of participants (x-axis). Asterisks indicate the statistical difference between the module eigengene significance (based on the correlation between the module eigengene and trait of interest) and the trait comparison groups. Asterisks indicate the corresponding p values. (D) GeneMANIA protein-protein interaction plot showing protein-coding–hub genes in the salmon module for nonresponders versus controls. Protein-coding–hub genes are shown with cross-hatched circles of a uniform size, while those that were added as relevant genes by GeneMANIA are shown with solid circles whose size is proportional to the number of interactions they have. Lines correspond to the type of interactions. Purple: Genes known to be co-expressed in existing gene databases. Pink: Proteins known to be linked. Turquoise: Genes present in a shared annotated pathway. Blue: Genes expressed in the same tissue. Orange: Predicted functional relationships between genes. Green: Predicated genetic interactions. Olive: Shared protein domains. Abbreviations: WGCNA, Weighted gene co-expression network analysis.