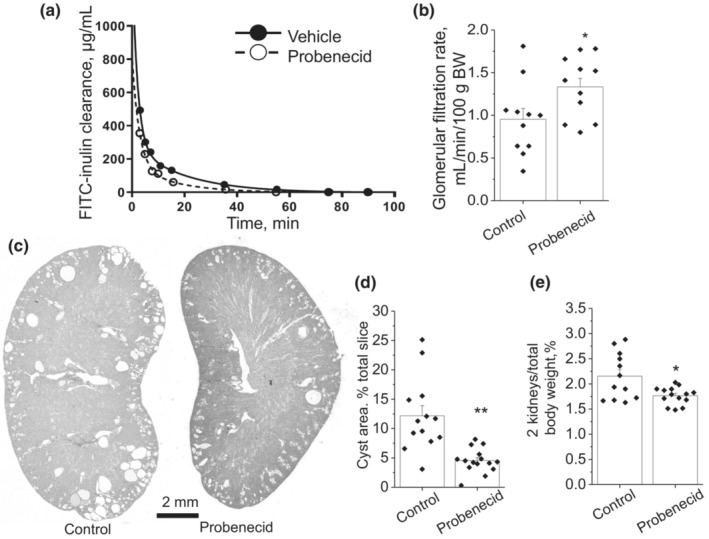
FIGURE 4.

Effect of 6‐week long administration of probenecid on the ADPKD development in the 1‐year‐old male Pkd1 RC/RC mice. (a) Representative curves of inulin blood plasma show faster clearance in probenecid‐treated versus control mice. (b) Summary graph of glomerular filtration rate (N = 11 in each group). (c) Representative transverse kidney sections in the vehicle‐ and probenecid‐treated groups. (d) Summary graph of cyst area percentage related to total slice area. (e) Smaller renal size after the treatment with probenecid, detected with two kidneys / total body weight percentage. *p < 0.05, **p < 0.01 per unpaired t‐test. N = 13 (vehicle), N = 15 (probenecid).
