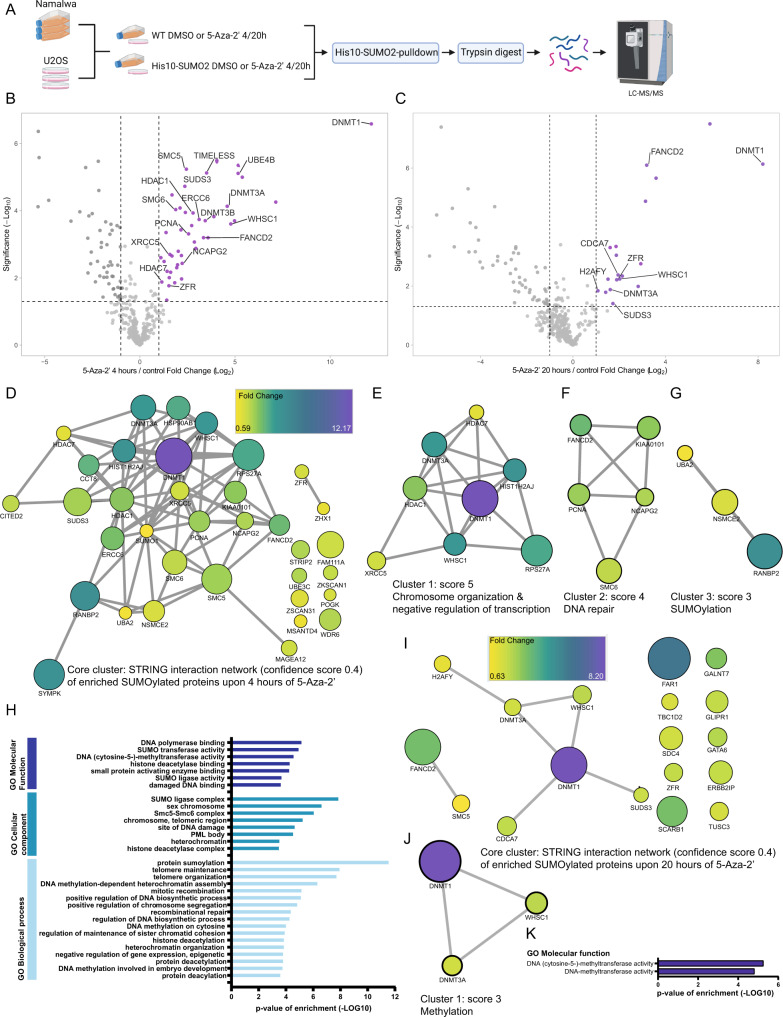
Fig. 2. 5-Aza-2’ treatment induces SUMOylation of DNA damage response factors and chromatin components in U2OS cells.
A Experimental overview created with BioRender.com for the SUMO2 target identification upon 4 or 20 h of 5-Aza-2’ treatment in U2OS and Namalwa cells. U2OS and Namalwa cells stably expressed His10-SUMO2. His10-SUMO2 targets were enriched via Ni-NTA pulldown. Proteins were trypsin digested and prepared for LFQ mass spectrometry. Four replicates were prepared per condition and analyzed by nano flow LC-MS/MS. B, C respectively show volcano plots visualizing all identified SUMOylated proteins in U2OS His10-SUMO2 upon 4 or 20 h of 5-Aza-2’ treatment (1 µM) compared to control. His-SUMO2 target proteins were enriched via Ni-NTA pulldown, followed by trypsin digestion and LFQ mass spectrometry, peptides were identified by LC-MS/MS. Dashed lines represent cut off at a foldchange of two (log2 = 1) and p-value of 0.05 (-log10 = 1.3) (n = 4). D STRING network analysis of enriched SUMOylated proteins upon 4 h of 5-Aza-2’ treatment with Cytoscape Software at a confidence score of 0.4. The interaction network visualizes fold change via node color as indicated in the scale bar (fold change of: 0.59–12.17) and significance indicated with node size. E MCODE was used to extract the most interconnected clusters from the STRING network analysis in D. Cluster 1 represents proteins involved in chromosome organization and negative regulation of transcription. F Cluster 2 represents DNA damage response proteins. G Cluster 3 represents proteins involved in SUMOylation. H Bar-graph visualizes Gene Ontology enrichment analysis of proteins SUMOylated upon 4 h of 5-Aza-2’ treatment, for GO molecular functions, GO Cellular components and GO Biological processes compared against the reference humane proteome. Only pathways significantly enriched and with a fold enrichment of more than 20 are shown. I STRING network analysis of enriched SUMOylated proteins upon 20 h of 5-Aza-2’ treatment with Cytoscape software at a confidence score of 0.4. The interaction network visualizes fold change via node color as indicated in the scale bar (fold change of: 0.63–8.2) and significance indicated with node size. J MCODE was used to extract the most interconnected clusters from the STRING network analysis in I. Cluster 1 represents proteins involved in methylation. K Bar-graph visualizes Gene Ontology enrichment analysis of proteins SUMOylated upon 20 h of 5-Aza-2’ treatment, for GO molecular functions. Only pathways significantly enriched and with a fold change of more than 20 are shown. Source data are provided as Source data file_MS or _GeneOntology.

