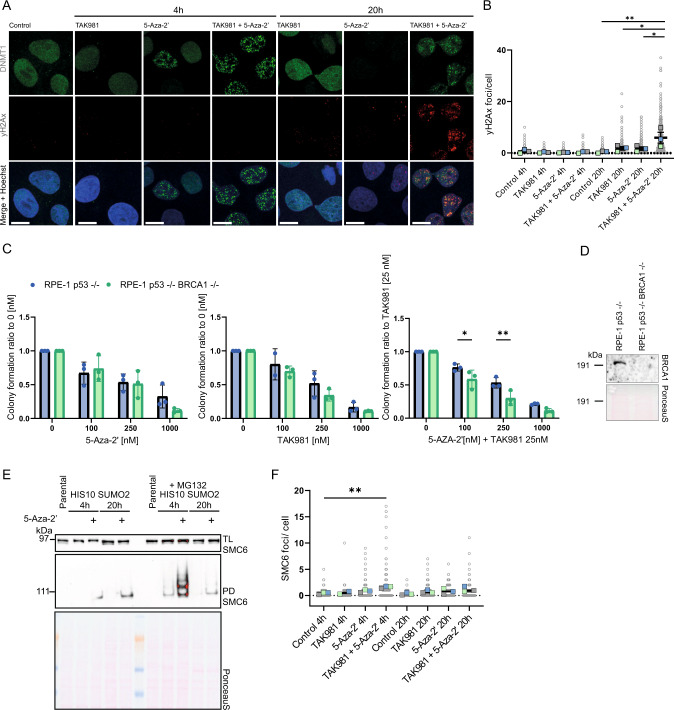
Fig. 3. The combination treatment of 5-Aza-2’ and TAK981 induces DNA damage.
A γH2Ax and DNMT1 foci visualized with confocal microscopy. U2OS cells cultured on glass cover slips were treated with 1 µM 5-Aza-2’ and/or 1 µM TAK981 or DMSO 0.1% as control for 4 or 20 h. Slides were stained with DNMT1 and γH2Ax antibodies. The panel shows representative images of each condition, single DNMT1 stain, single γH2Ax stain and a merged image including Hoechst staining. Scale bar represents 25 µm B γH2Ax foci quantification of images from A. Dots represent numbers of γH2Ax foci/cell using ~100 cells per replicate (n = 3). P-value * ≤ 0.05. One-way ANOVA was used, followed by Tukey’s multiple comparisons with Graphpad prism Version 9.3.1. C BRCA1 knock out in RPE-1 p53-/- cells was validated via immunoblotting. PonceauS staining was used as loading control. D Colony formation analysis of homologous recombination (HR) deficient cell line RPE-1 p53-/- BRCA1-/- vs RPE-1 p53-/- 2,500 cells were seeded per well in 6-well plates, treated with 5-Aza-2’ and/or TAK981 at the indicated doses and grown for 14 days. Subsequently, cells were fixed, stained with crystal violet and quantified. P-value * ≤ 0.05, ** ≤ 0.01. Two-sided t-test RPE-1 p53-/- BRCA1-/- vs RPE-1 p53-/- per treatment condition with Graphpad Version 9.3.1. E Ni-NTA pulldown of His10-SUMO2- for validation of targets from mass spectrometry analysis (Fig. 2). U2OS cells were cultured in suspension and treated for 4 or 20 h with 1 µM 5-Aza-2’ or DMSO 0.1% control with or without MG132 10 µM for 4 h and 2.5 µM for 20 h. Total lysate input and His10-SUMO2- pulldown elutions were analyzed by immunoblotting using SMC6 antibody. Equal loading was verified with Ponceau S staining. F SMC6 foci were identified via confocal microscopy upon treatment with 1 µM 5-Aza-2’ and/or 1 µM TAK981 for 4 or 20 h and quantified. Dots represent numbers of SMC6 foci/cell using ~50–100 cells per replicate (n = 3). P-value * ≤ 0.05, ** ≤ 0.01. One-way ANOVA, Tukey’s multiple comparisons with Graphpad prism Version 9.3.1.

