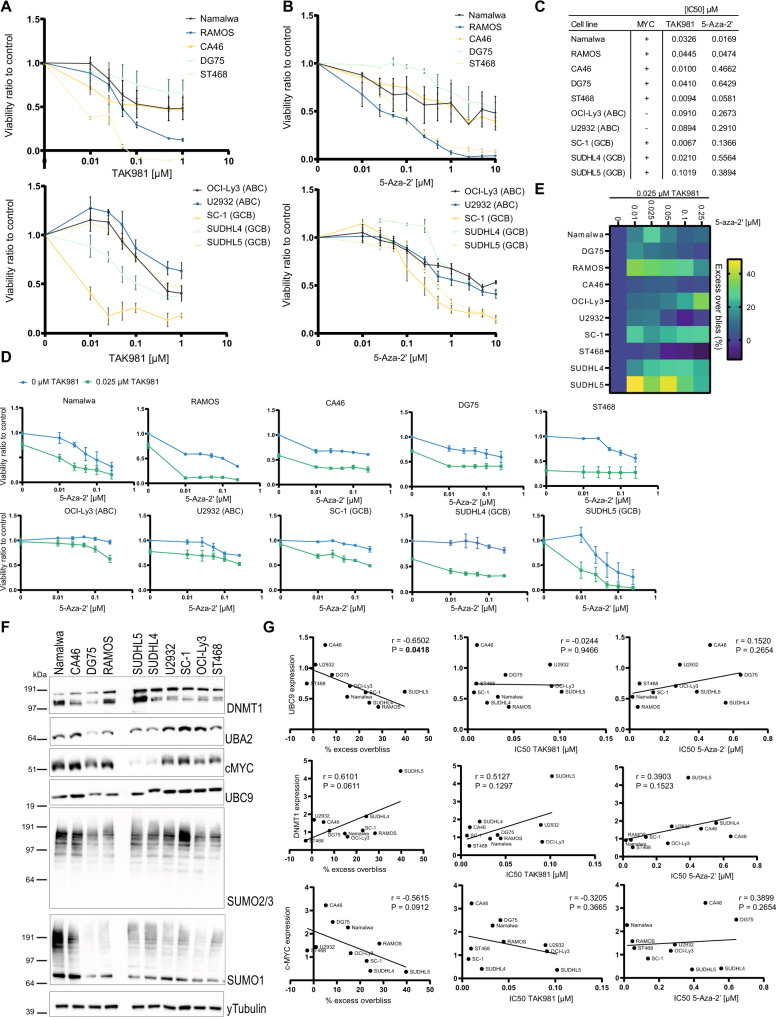
Fig. 4. 5-Aza-2’ and TAK981 synergize to reduce lymphoma tumor cell growth.
A A panel of ten lymphoma cell lines was treated with TAK981 at a dose range of 0.01–1 µM and cell viability was measured after 4 days. Cells were divided over two graphs respectively: Burkitt Lymphoma cell lines and DLBCL cell lines. The graphs show cell viability in ratio to control per cell line. B The panel of ten lymphoma cell lines was treated with 5-Aza-2’ at a dose range of 0.01–10 µM and cell viability was measured after 4 days. Cells were divided over two graphs respectively, representing Burkitt Lymphoma cell lines or DLBCL cell lines. The graphs show cell viability in ratio to control per cell line. C IC50 values of the cell line panel for TAK981 0.00001–1 µM dose response and 5-Aza-2’ dose response 0.01–10 µM. IC50 values were calculated in Graphad Version 9.3.1. and MYC status for all cell lines ‘+’ indicates translocation of MYC gene (Table 1), ‘-‘ represents no change in MYC gene (Table 1). D The panel of ten lymphoma cell lines was treated with 5-Aza-2’ at the indicated dose range with or without 25 nM TAK981. Viability dose response curves were plotted individually per cell line. E Excess overbliss (%) of plots in D was calculated as detailed in methods section and visualized in a heat map (Higher % excess overbliss represents more synergy) for each dose of 5-Aza-2’ versus the same dose with 25 nM TAK981. F Total lysates of the panel of ten lymphoma cell lines were analyzed for protein expression levels of DNMT1, UBA2, MYC, UBC9, SUMO2/3 and SUMO1 by immunoblotting. γTubulin staining was used as a control. Immunoblotting of representative image of a total of n = 3 is shown. G Correlation of IC50 value and average excess overbliss percentage per cell line vs protein expression of DNMT1, UBC9 and MYC. Correlation was calculated in Graphpad Prism 9.3.1. Pearson r and P-value. Correlation data of the remainder of the proteins is depicted in Supplementary Fig. 2.

