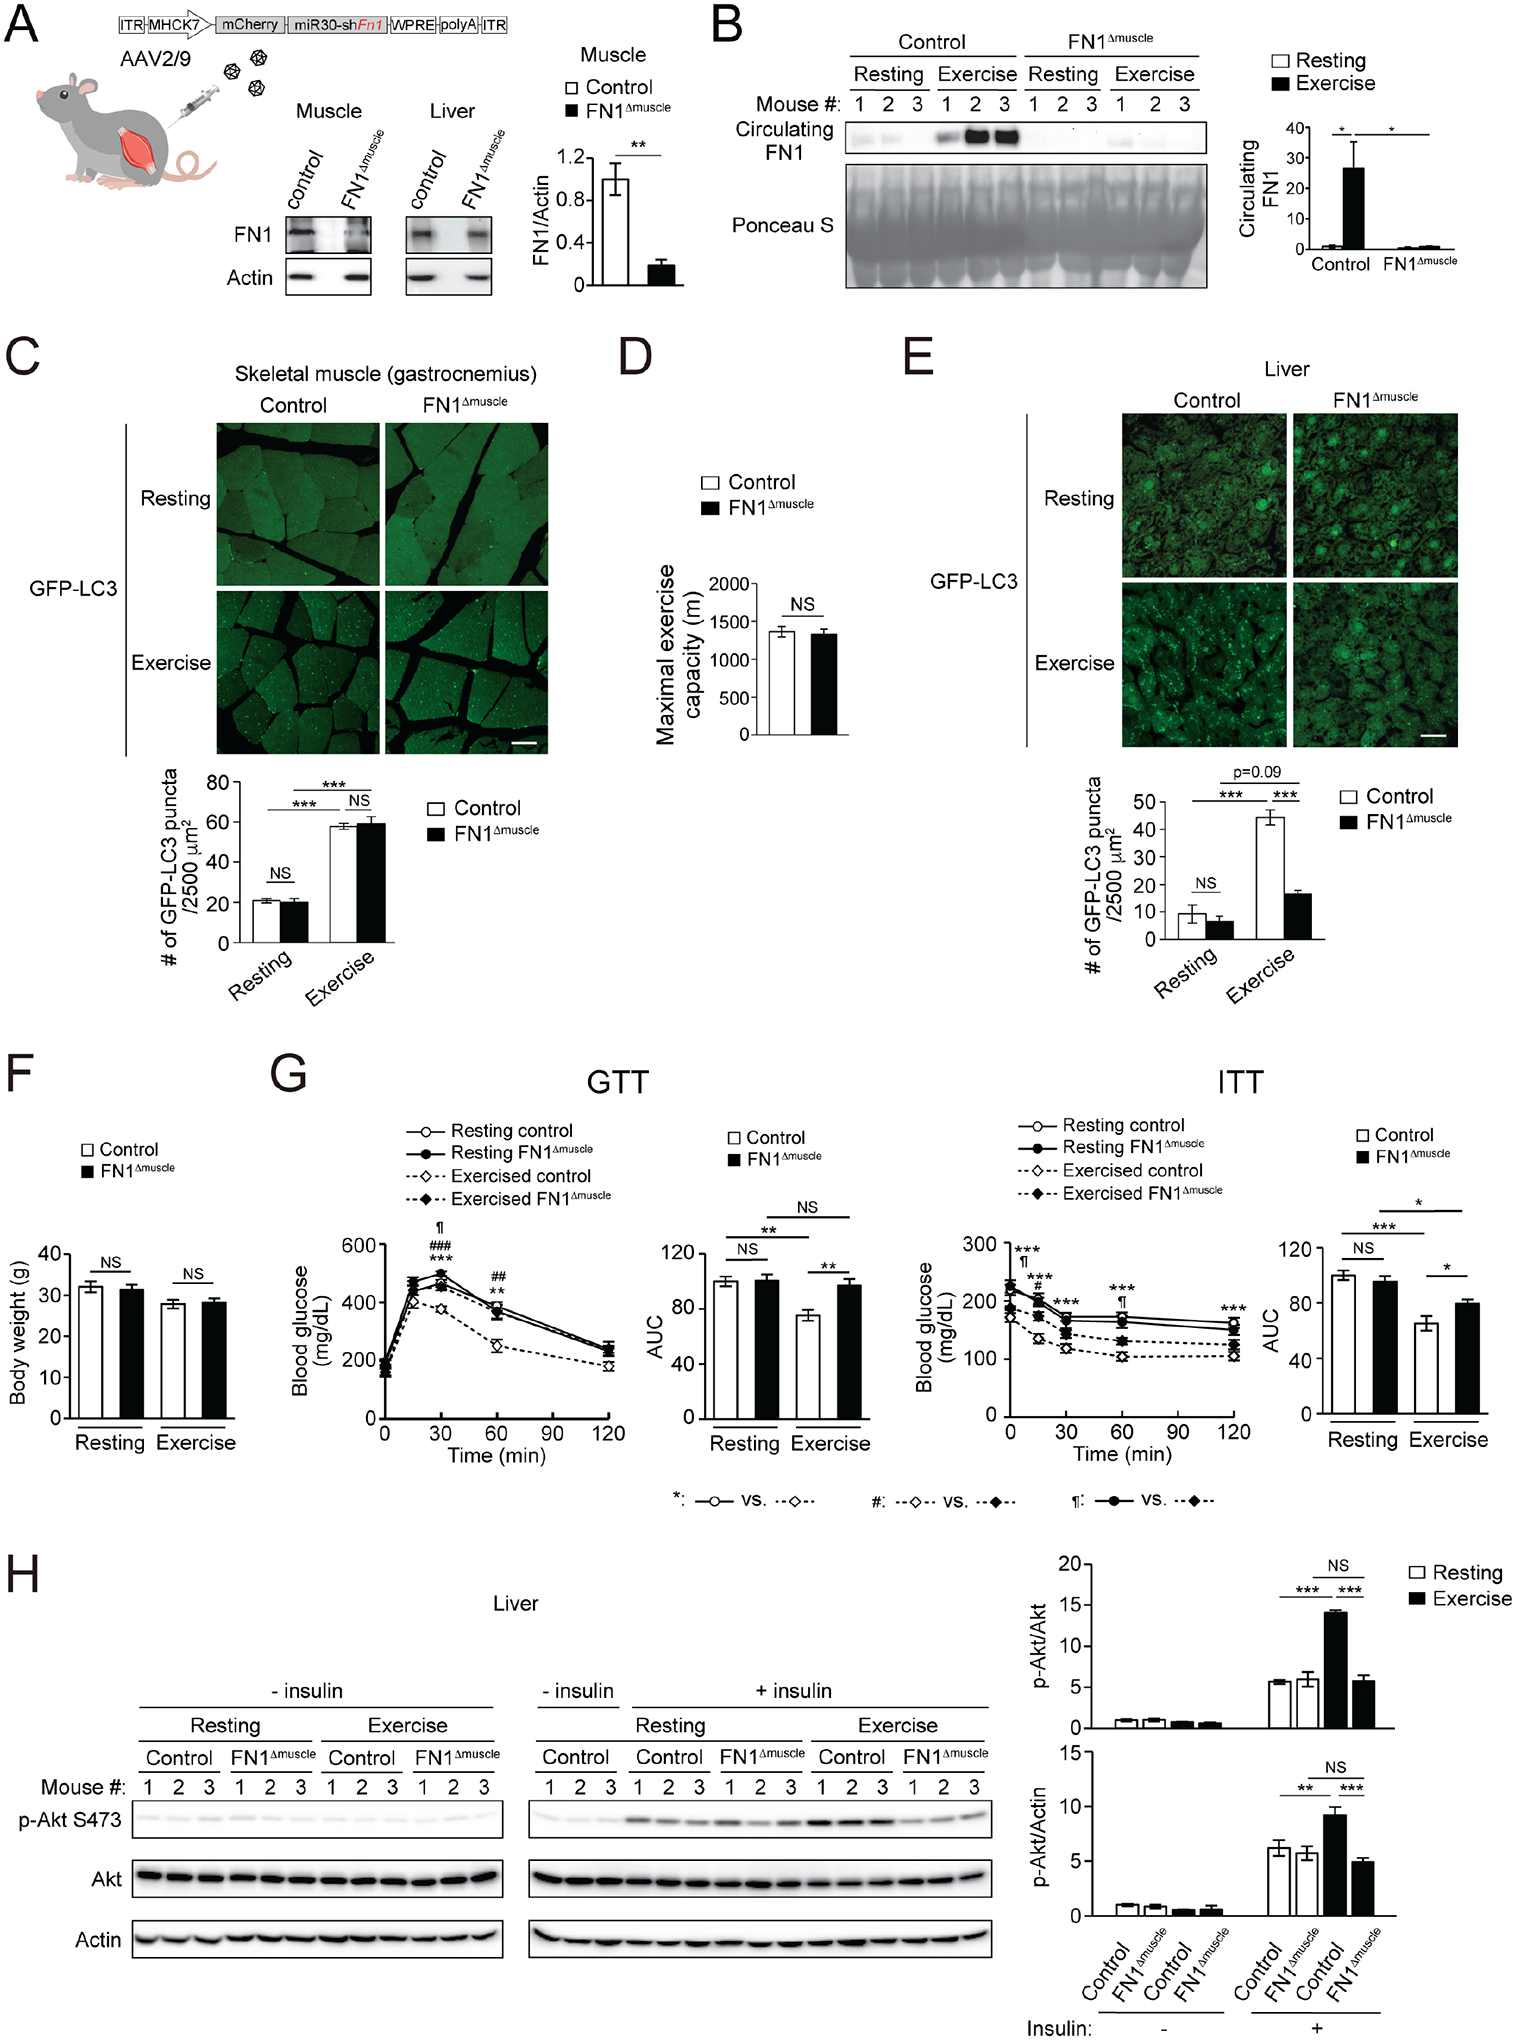
Figure 3. FN1 secreted from contracting muscle mediates exercise-induced hepatic autophagy and systemic insulin sensitization.

(A) FN1 levels in skeletal muscle and liver of WT mice i.v. injected with control AAV (control mice) or AAV2/9-MHCK7 promoter-mCherry-miR30-shFN1 (FN1Δmuscle mice). N=3–4. (B) Circulating FN1 levels of control mice or FN1Δmuscle mice at rest or after 90-min exercise. N=3. (C) GFP-LC3 puncta in skeletal muscle of control or FN1Δmuscle mice expressing the GFP-LC3 reporter at rest or after 90-min exercise. N=3 mice (15–16 areas/mouse). Bar, 25 μm. (D) Maximal running distance of control or FN1Δmuscle mice on a treadmill. N=6 mice. (E) GFP-LC3 puncta in the liver of control or FN1Δmuscle mice expressing GFP-LC3 at rest or after 90-min exercise. N=3 mice (12 areas/mouse). Bar, 25 μm. (F) Comparable body weight of control and FN1Δmuscle mice under HFD feeding, with or without daily exercise for 7 weeks. N=7–9. (G) GTT and ITT of control or FN1Δmuscle mice fed with HFD with or without daily 50-min exercise for 7 weeks. AUC, area under the curve. N=6–9. (H) WB analysis of insulin-stimulated Akt phosphorylation in the liver of control or FN1Δmuscle mice fed with HFD with or without daily 50-min exercise for 7 weeks, and then injected with 2 U/kg insulin 15 min prior to tissue collection. The “- insulin resting” controls were loaded twice on both gels to allow for normalization of samples to the same controls. N=3. (A, D), t-test. (B-C, E-H), one-way ANOVA with Tukey-Kramer test. *, ¶, P<0.05; **, ##, P<0.01; ***, ###, P<0.001; NS, not significant.
