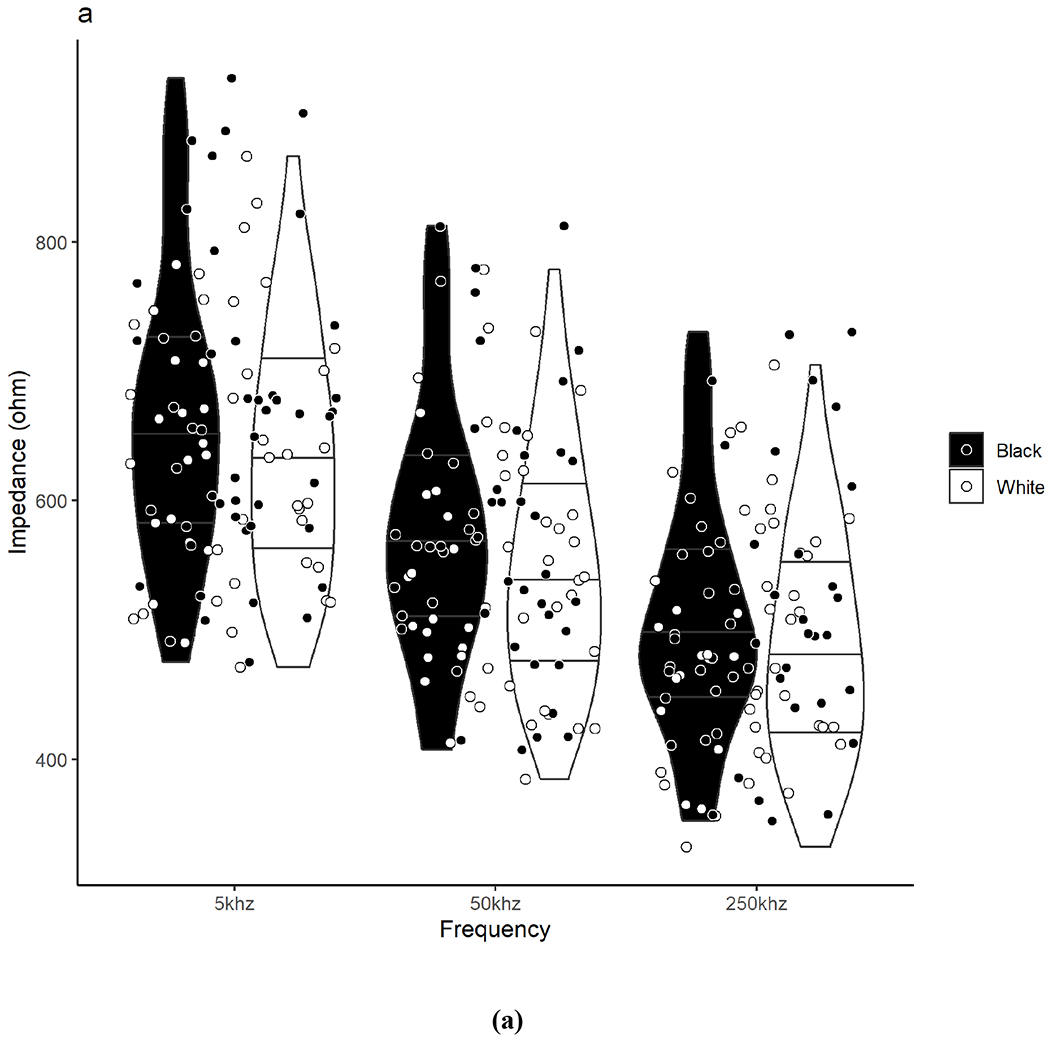
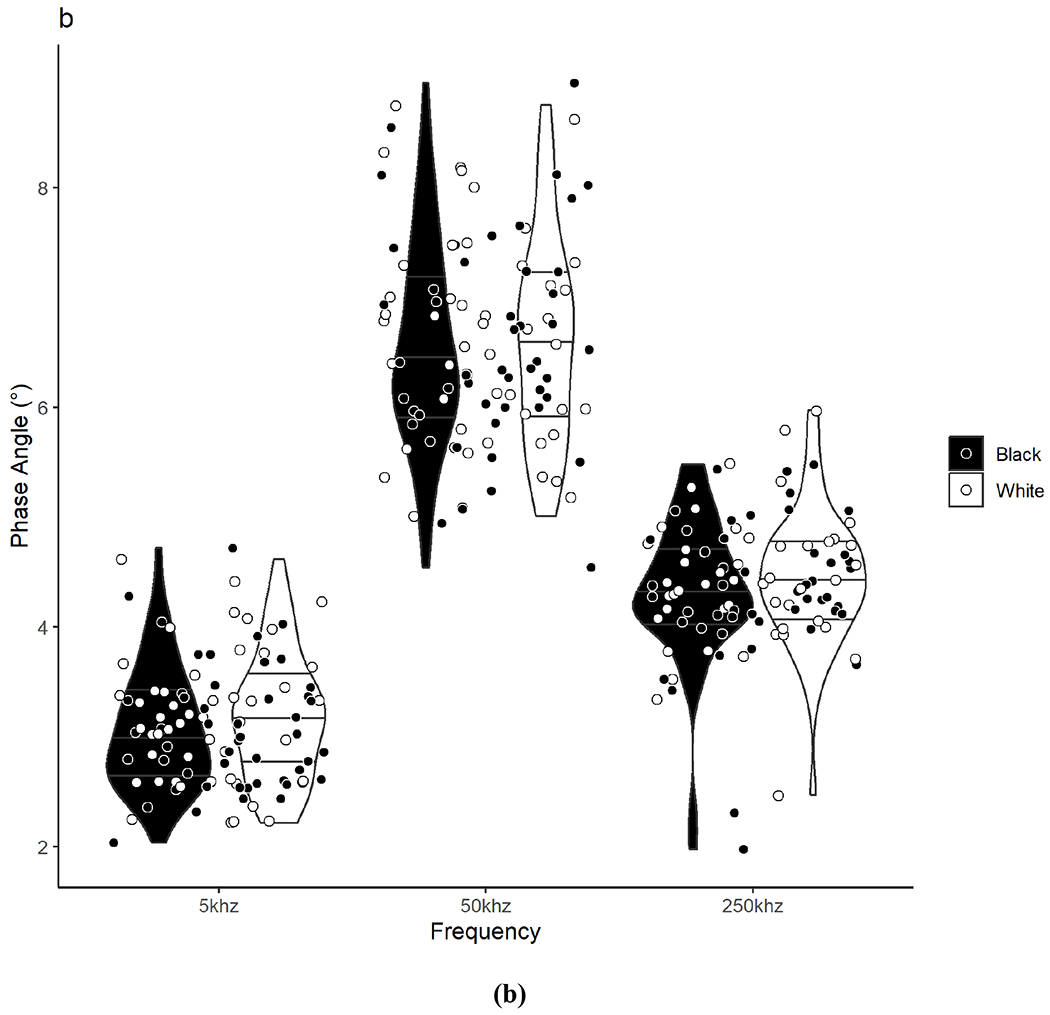
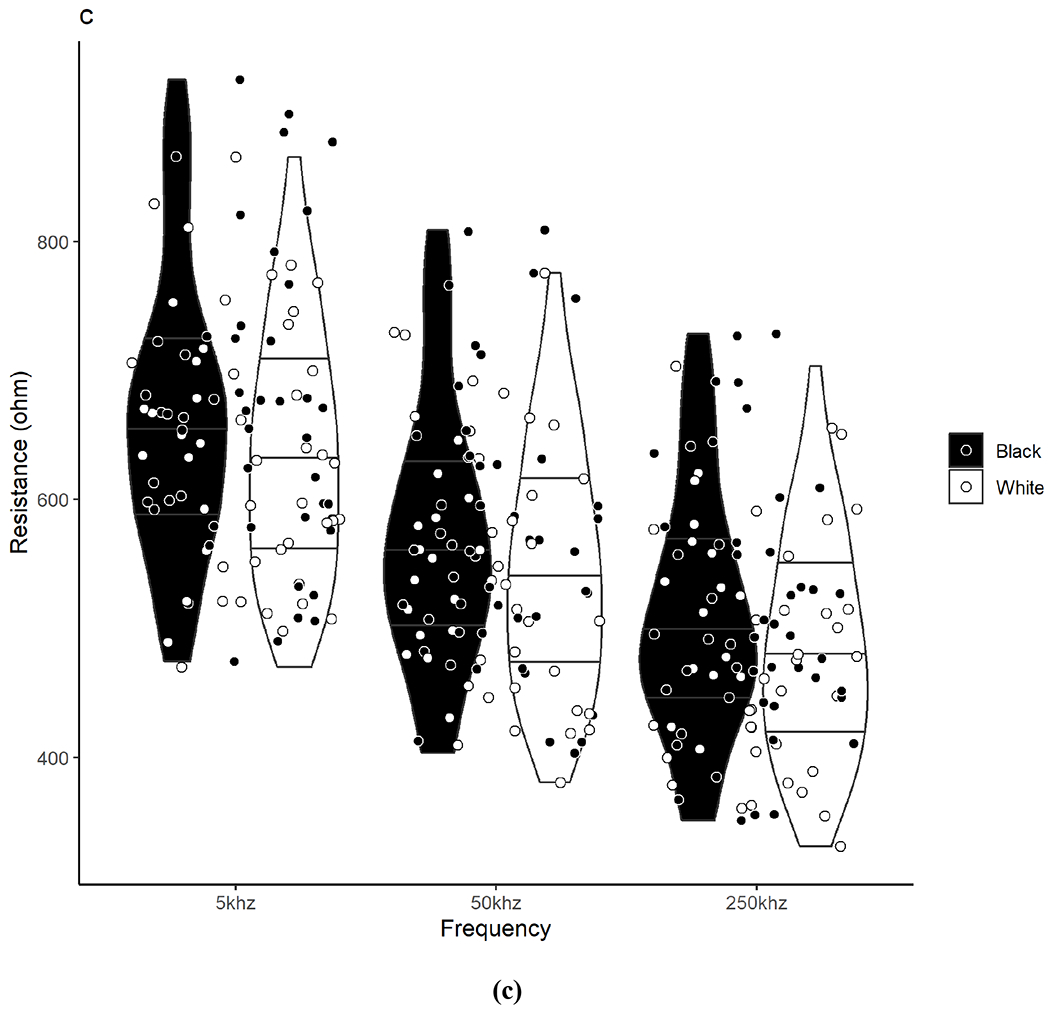
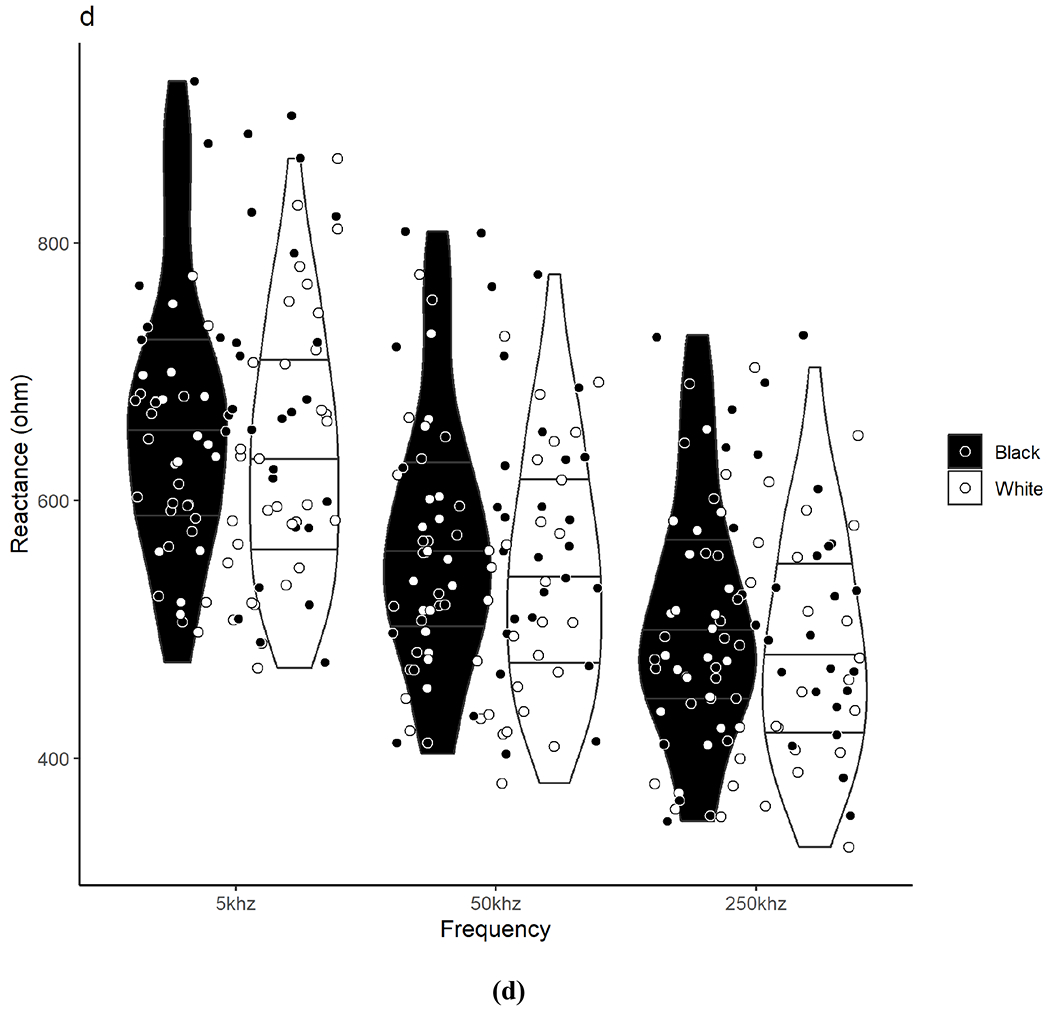
Figure 1. Raw Bioelectrical Impedance Analysis Between Black and White Adults.


Violin plots show the density/distribution of the group data and individual datapoints for each Black and White participant for assessments of (a) impedance, (b) phase angle, (c) resistance, and (d) reactance measured at 5, 50, and 250 kHz. The y-axis represents the raw bioelectrical impedance values and the x-axis represents the measured frequencies. The bottom line within each violin represents the 25th quartile, the middle line represents the 50th quartile, and the top line represents the 75th quartile. Data were analyzed using independent t-tests. No significant differences were observed between Black and White adults for any measure across frequencies.
