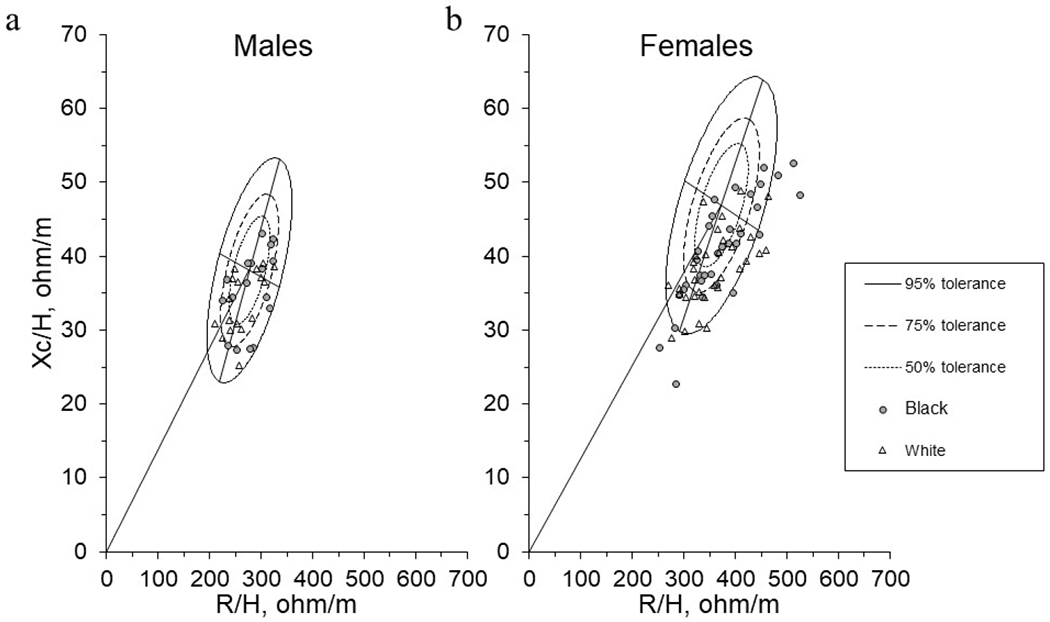
Figure 3. Mean Impedance Vectors between Black and White Adults using Tolerance Ellipses Generated from a White Adult Reference.

Mean impedance vectors with tolerance ellipses of 50%, 75%, and 95% produced from White (a) male and (b) female adult references. Tolerance ellipses were visually interpreted as the individual vector position relative to the reference. Vectors outside of the 75% tolerance ellipse indicate an abnormal Z with vector displacements on the major axis (vertical) representing abnormal tissue hydration and vector displacements on the minor axis (horizontal) representing abnormal soft tissue mass.
