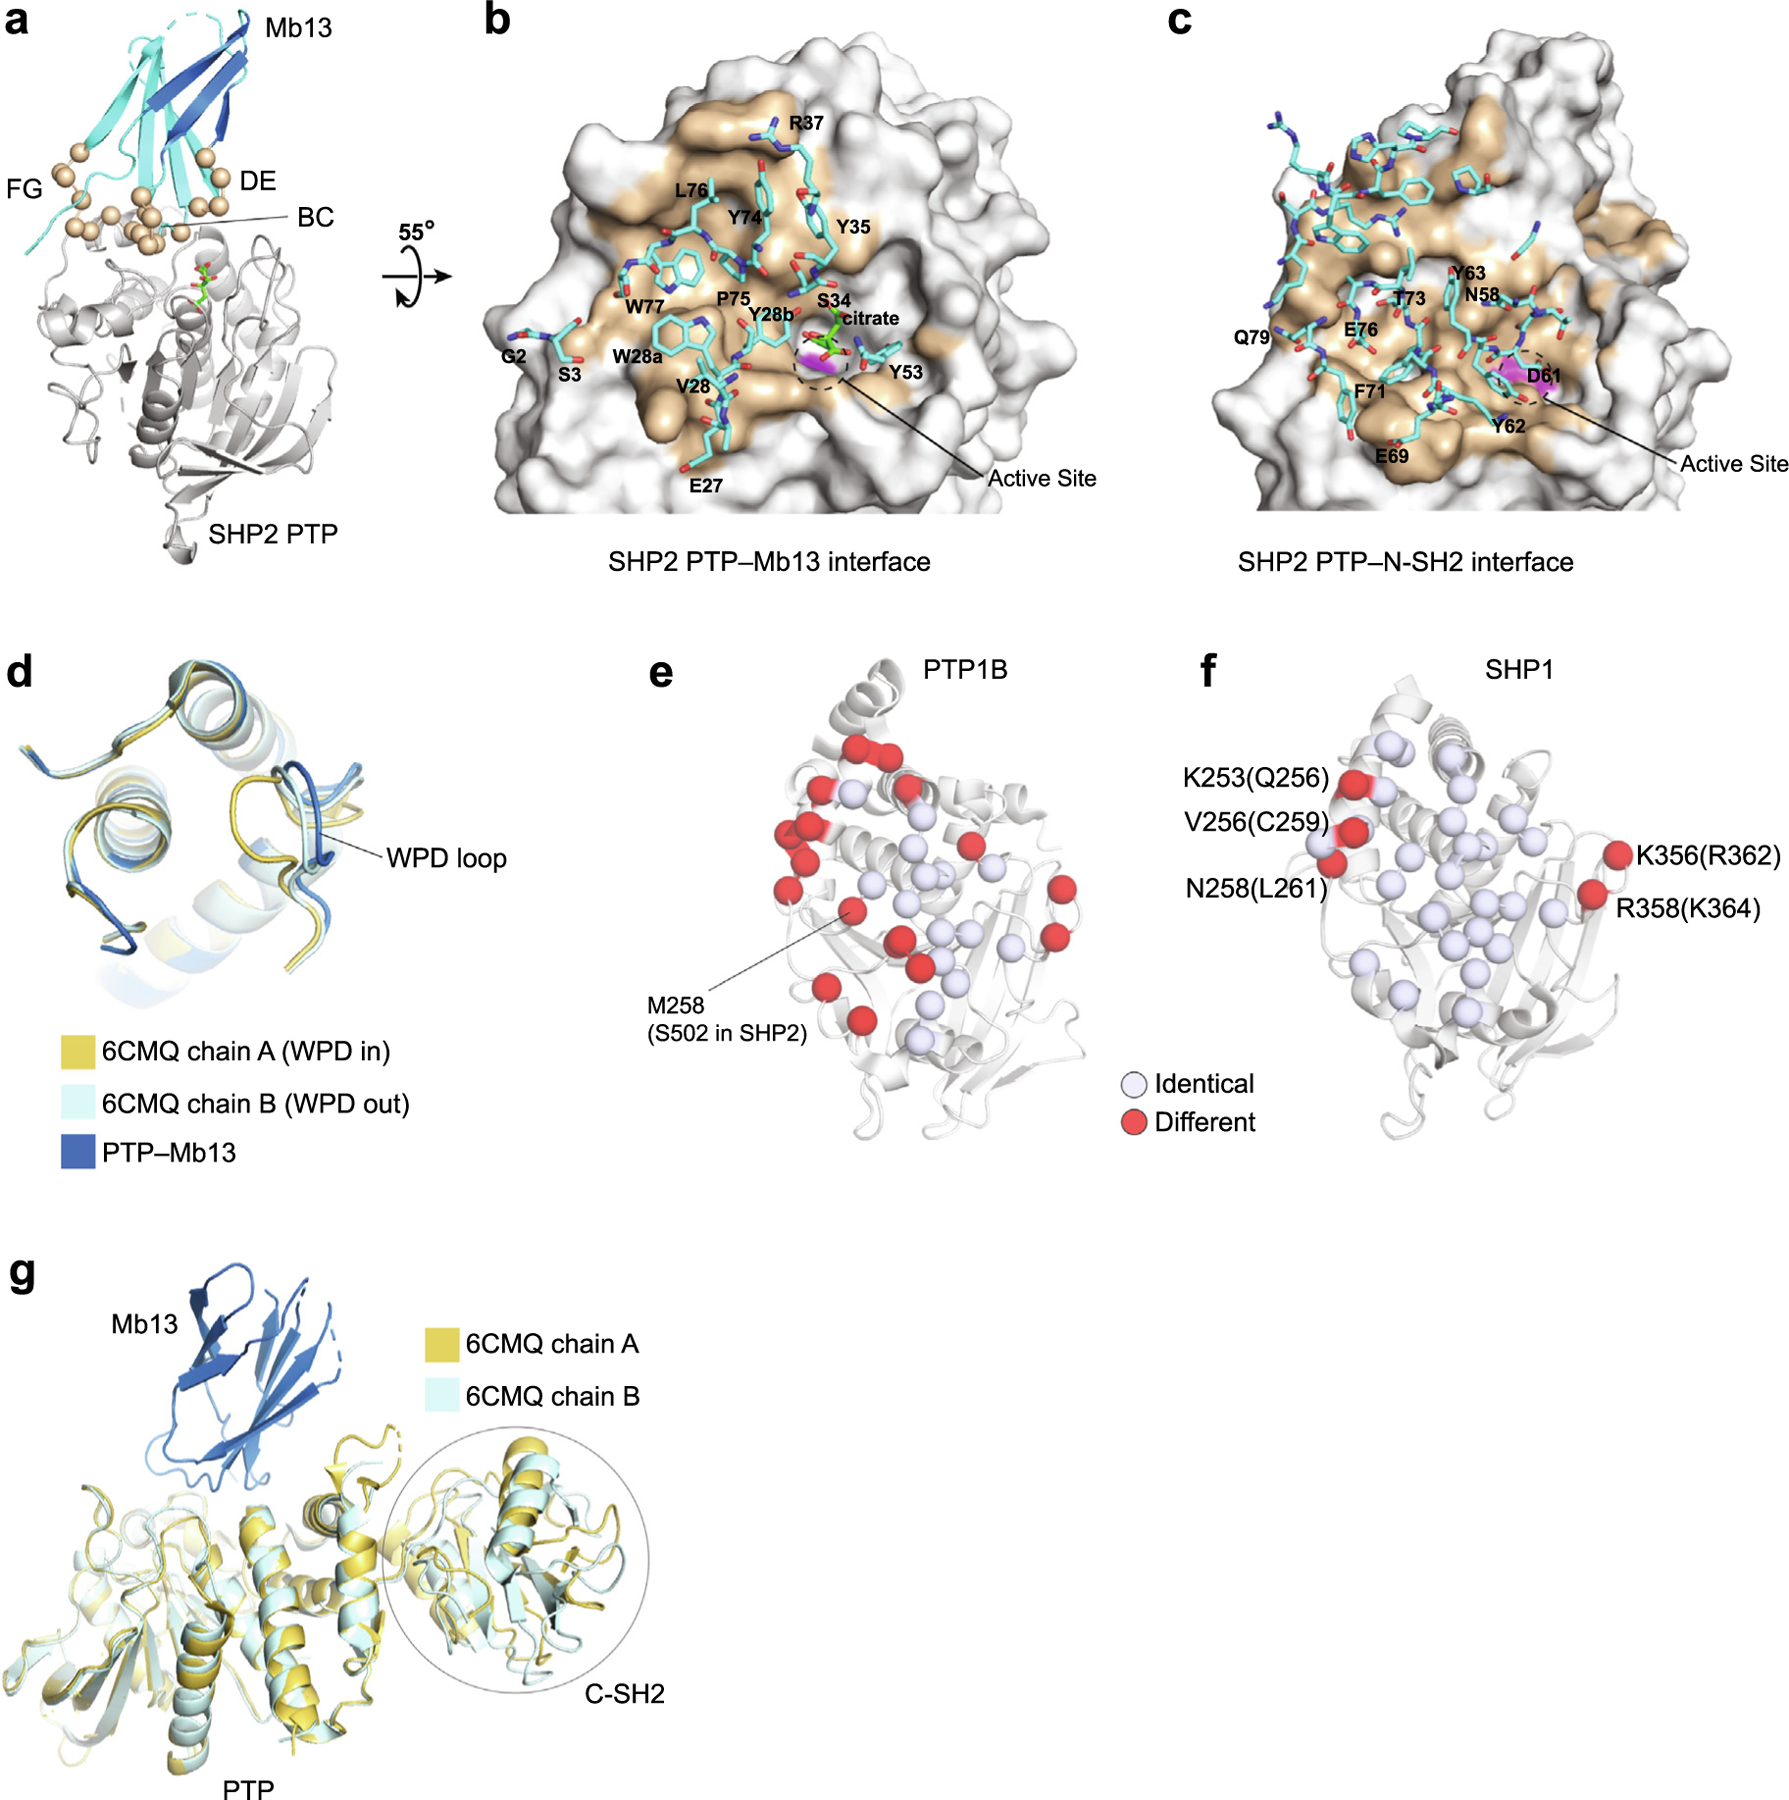
Figure 2.

Crystal structure of the SHP2 PTP–Mb13 complex. (a) The PTP–Mb13 complex. Residues diversified in the library are shown as spheres. (b) Close up of the PTP–Mb13 interface, in which PTP is represented as a surface model with the epitope in brown and residues within the paratope of Mb13, as defined as those within 5 Å of PTP atoms, are represented as sticks and labeled. The active-site is marked with the dashed circle, with the C459 surface in magenta. (c) Close up of the SHP2 PTP–N-SH2 interface in the autoinhibited SHP2 structure (PDB ID 2SHP) as viewed in the same orientation as in panel b. Residues of N-SH2 within 5 Å of PTP atoms are represented as sticks. A subset of residues is labeled for brevity. (d) Comparison of the PTP conformation in the Mb13 complex with representative, WPD-in and WPD-out conformations reported previously (PDB ID 6CMQ). Only the vicinity of the active site is shown for clarity. (e, f). Conservation of Mb13 epitope residues, defined as those residues that are located within 5 Å of Mb13, between SHP2 and PTP1B (e) and between SHP2 and SHP1 (f). The identical residues in the epitope are shown as white spheres and different residues in red. The different residues in SHP1 are labeled and their corresponding SHP2 residues are shown in the parentheses. (g) Superposition of the SHP2 PTP–Mb13 complex with the SHP2ΔN-SH2 structure (PDB ID 6CMQ) using the PTP, showing that there are no steric clashes between Mb13 and the C-SH2 domains in the SHP2ΔN -SH2 structure.
