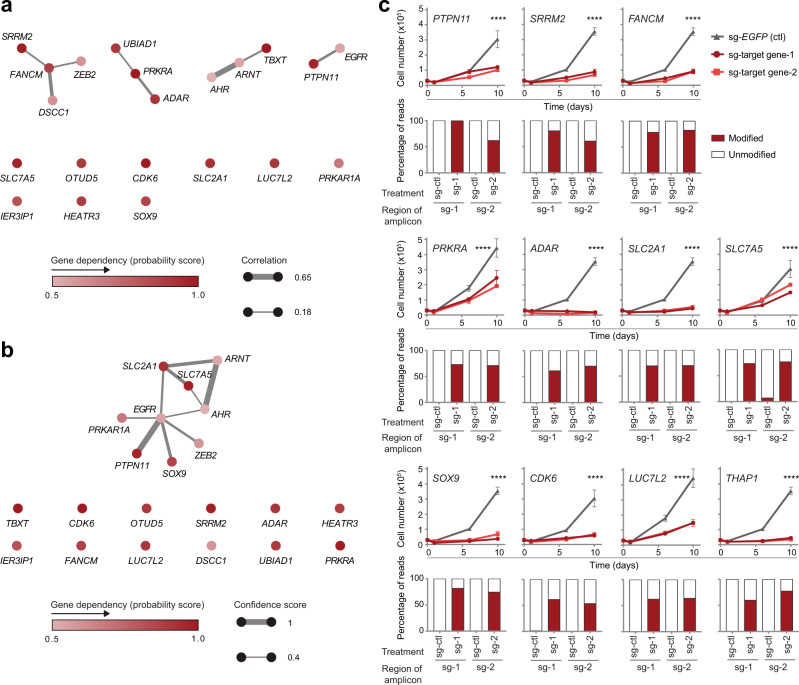
Fig. 2. Validation of candidate chordoma dependency genes.
a Co-essentiality network for selective chordoma dependency genes. Nodes: chordoma dependency genes, colored by dependency probability scores. Edges: Pearson correlation coefficient ≥0.18 between dependency profiles for connected gene pairs, i.e., dependency probability scores across all 769 cancer cell lines; edge width scaled by correlation coefficient. For clarity, we show all genes included in the analysis by listing singletons (genes without connections exceeding our thresholds) below the connected components of the network. b STRING protein-protein interaction network for selective chordoma dependency genes. Nodes: chordoma dependency genes, colored by dependency probability scores. Edges: putative interactions with a STRING confidence score ≥0.4; edge width scaled by confidence score. c (Top rows) Proliferation of Cas9-expressing UM-Chor1 chordoma cell lines transduced with one of two distinct sgRNAs targeting a candidate dependency gene or a non-targeting sgRNA control. Points represent the mean ± s.d. (n = at least 3 biological samples measured in parallel). ****P < 0.0001, derived from a two-way analysis of variance (ANOVA). P values for the test comparing sg-EGFP and sg-target gene-1 are displayed and refer to the time × treatment interaction. Additional details of P values and effect sizes are reported in Supplementary Data 7. Graphs with identical sg-EGFP control curves reflect experiments performed in parallel on the same day. (Bottom rows) Amplicon sequencing results confirm on-target editing following sgRNA treatment. We quantified the percentage of modified (red) versus unmodified (white) reads of the targeted genomic site following sgRNA treatment of UM-Chor1-Cas9 cells (sg-EGFP non-targeting control or one of two distinct sgRNAs targeting a candidate dependency gene). The small fraction of “modified” reads observed for the sg-SLC7A5−2-targeted amplicon with sg-EGFP control treatment originates from a residual amount of single-nucleotide variation we were unable to match to genomically defined off-target amplicons. However, their distribution points to an additional off-target amplicon as the source (rather than true editing events). Source data are provided as a Source Data file.

