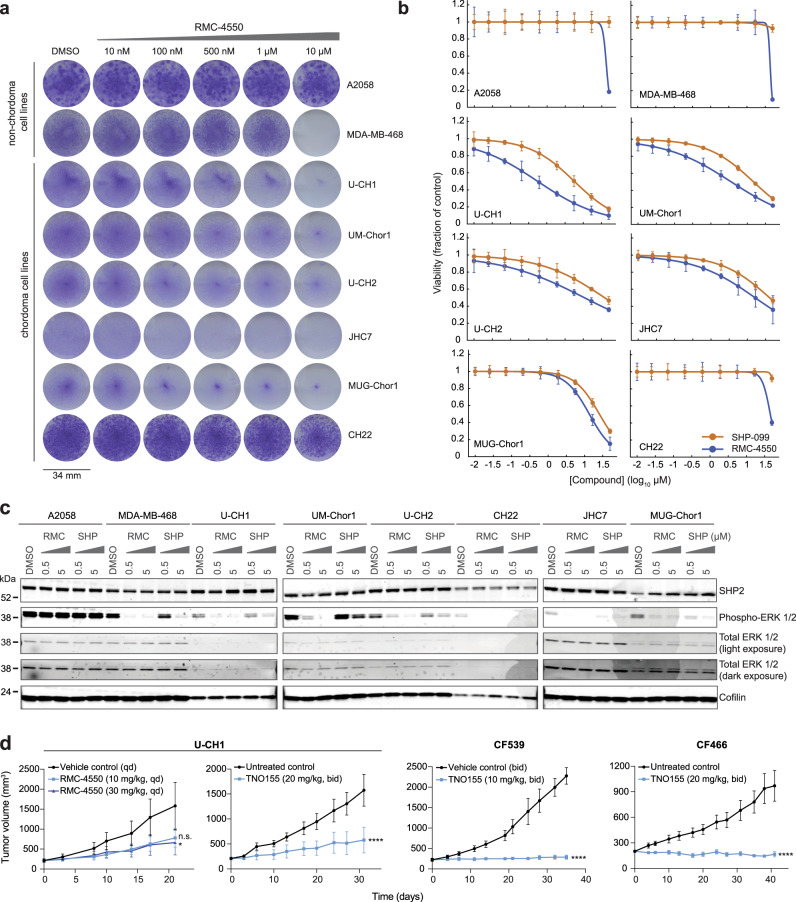
Fig. 5. Inhibitors of SHP2, encoded by PTPN11, represent candidate therapeutic agents against chordoma.
a Colony formation assays of chordoma and non-chordoma (negative control A2058; positive control MDA-MB-468) cell lines treated with indicated concentrations of RMC-4550 for 14 days. b Viability of chordoma and non-chordoma (negative control A2058; positive control MDA-MB-468) cell lines treated with indicated concentrations of SHP2 inhibitors RMC-4550 and SHP099 and assayed for cell viability after 6 days with CellTiter-Glo. Response data were represented by a fitted curve to the mean fractional viability at each concentration relative to vehicle-treated cells; error bars represent the s.e.m. (n = 4 biological samples measured in parallel). c Immunoblot analysis of chordoma and non-chordoma (negative control A2058; positive control MDA-MB-468) cell lines treated with indicated concentrations of RMC-4550, SHP099, or DMSO for 2 h. d Tumor proliferation in mice engrafted with chordoma cells (U-CH1 cell line-derived xenograft, CF539 PDX, or CF466 PDX) and treated with a SHP2 inhibitor (RMC-4550 or TNO155). Points represent the mean tumor volume ± s.e.m. (n = 4 (control) or 5 (compound) tumors for each arm of the U-CH1/RMC-4550 study; n = 6 (compound) or 7 (control) tumors for each arm of the U-CH1/TNO155 study; n = 6 (control) or 7 (compound) tumors for each arm of the CF539 study; n = 7 tumors for each arm of the CF466 study). n.s., not significant, *P < 0.05, ****P < 0.0001, derived from a two-way analysis of variance (ANOVA) with repeated measures. P values for the time × treatment interaction (relative to the control condition) are indicated. Additional details of P values and effect sizes are reported in Supplementary Data 7. Source data are provided as a Source Data file. See also related Supplementary Data 6.

