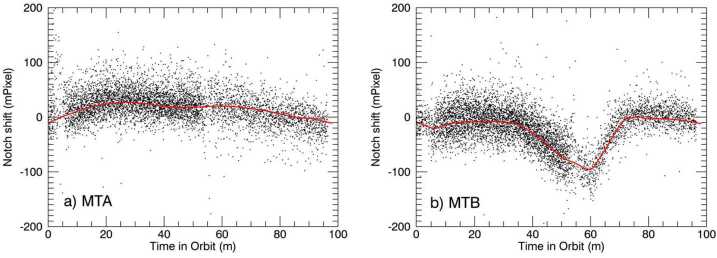
Fig. 19.
(a) The black dots are the results of the time-dependent notch position fits for every image in fifty calibration orbits of MIGHTI-A. This includes data from both neon/red during the day and krypton/green at night. The red trace is the high-precision shape of the intra-orbit image shift determined from these data. In daily wind analysis this shape is simply offset to best match the notch positions determined from the calibration orbit that day. (b) Similar to (a), but for MIGHTI-B. Note that a notch shift of 2.48 (6.68) mPixel is equivalent to a wind speed of 1 m/s for the red (green) oxygen airglow lines (see Table 1)

