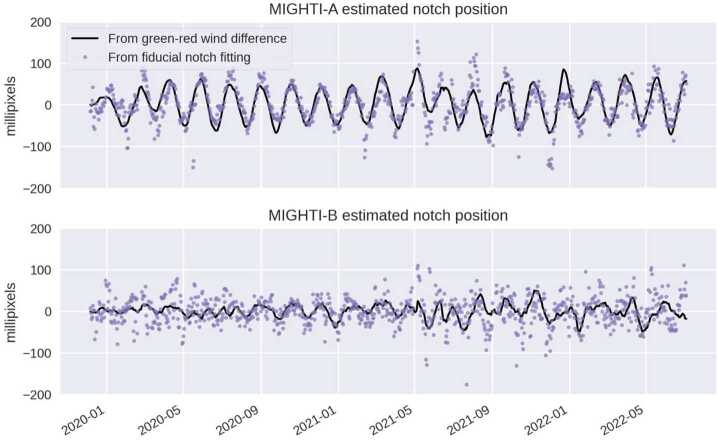
Fig. 21.
Two ways of characterizing image shift on the CCD are shown. The black line is based on the condition of equal winds for the red- and green-line retrievals (used operationally for v05 data), after the removal of the longer term drifts via subtraction of a 48 day mean. The purple dots are from first-principles fits of the fiducial notch pattern, similar to Fig. 20. A 48-day rolling-window median has been removed from these latter data for consistency. The data shows clear similarity between the image shifts oscillations with the frequency of the precession cycle

