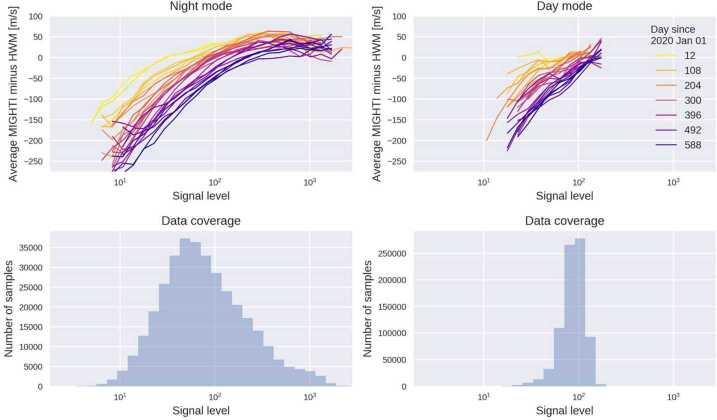
Fig. 23.
The difference between MIGHTI wind estimates and HWM14, binned as a function of signal level. Data between Jan 2020 and Oct 2021 are analyzed, with each 48-day precession cycle analyzed independently, resulting in the colored lines (top panel). The histogram of signal level is shown in the bottom panels. The signal level is defined as the DC value of the interferogram during the day, and 13.3 times that value at night (to account for the increased sensitivity). A clear negative systematic error is seen at low signal levels. Data from the red-line channel at ∼244 km altitude in MIGHTI-A are shown. Green-line results are qualitatively similar, except the histograms are shifted to the right (i.e., there is less of an effect on most green-line wind data). MIGHTI-B results are similar

