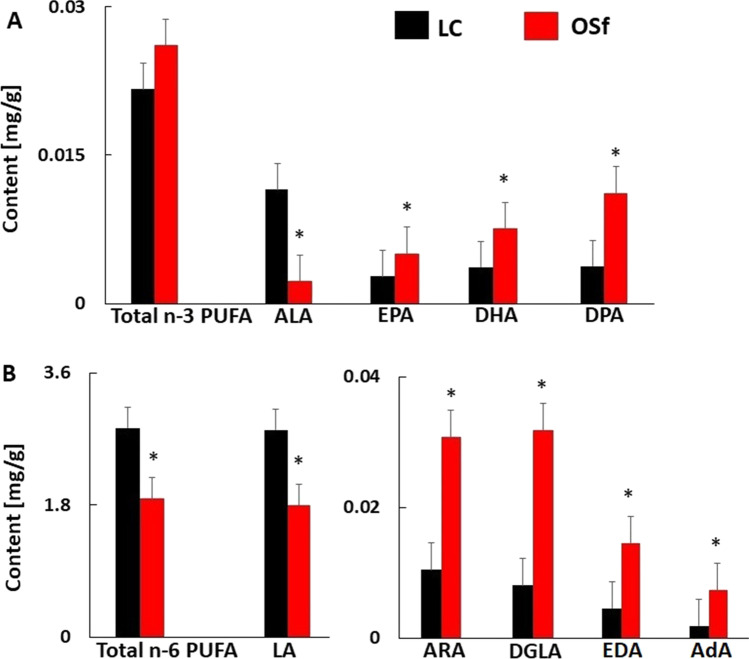
Fig. 1.
Comparison of the fecal n-3 (A) and n-6 (B) PUFA content (mg/g) in study groups. Data are presented as mean ± SD. LC, lean controls; OSf, subjects with obesity (group included in analysis of faces). The significance is as follows: ALA p = 0.003, EPA p = 0.036, DHA p = 0.031, DPA p = 0.018, Total n-3 PUFA p = 0.243, LA p = 0.041, ARA p = 0.005, DGLA p = 0.010, EDA p = 0.007, adrenic acid (AdA; 22:4 n-6) p = 0.004, Total n-6 PUFA p = 0.005

