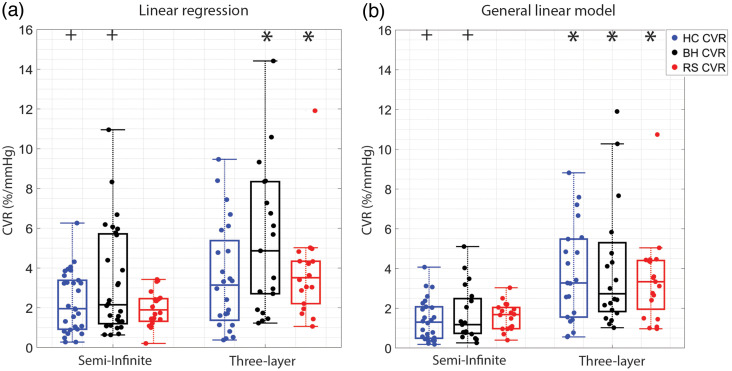
Fig. 2.
CVR across experimental paradigms: boxplots of CVR (%/mmHg) estimated with (a) linear regression and (b) a GLM using both semi-infinite and three-layer DCS analytical models during HC (blue), BH (black), and RS (red) experimental paradigms. For each boxplot, the central line denotes the median, and the bottom and top edges of the box indicate the 25’th and 75’th percentiles, respectively. The whiskers extend to the most extreme data points not considered outliers. Individual data are also included. * denotes significant difference between semi-infinite and three-layer for a given CVR paradigm and numerical method (). + denotes significant difference between linear regression and the GLM estimate of CVR for a given experimental paradigm ().

