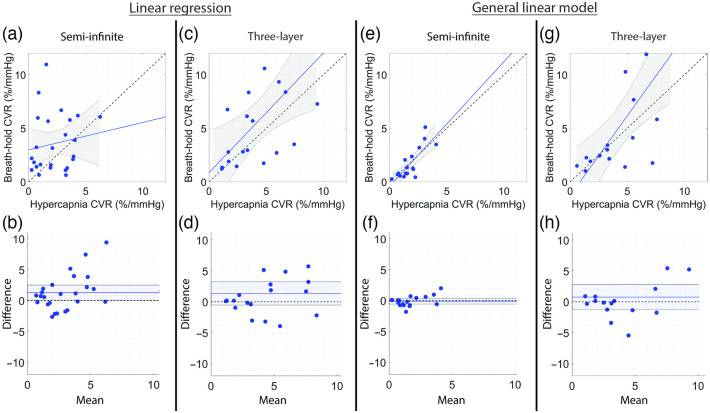
Fig. 3.
Relationship between HC and BH CVR. (a), (c), (e), and (g) Relationship between CVR estimated during HC versus BH and (b), (d), (f), and (h) corresponding Bland-Altman plots of the difference versus mean CVR estimated with linear regression (left columns) and GLMs (right columns) using the semi-infinite or three-layer model for DCS analysis. In panels (a), (c), (e), and (g), the dotted line represents the line of unity, and the solid line represents the best linear fit and 95% confidence interval (gray shaded region). In panels (b), (d), (f), and (h), the mean bias (solid line) and its 95% confidence interval (shaded region) are compared to the line of equality (dotted black line).

