Fig. 1.
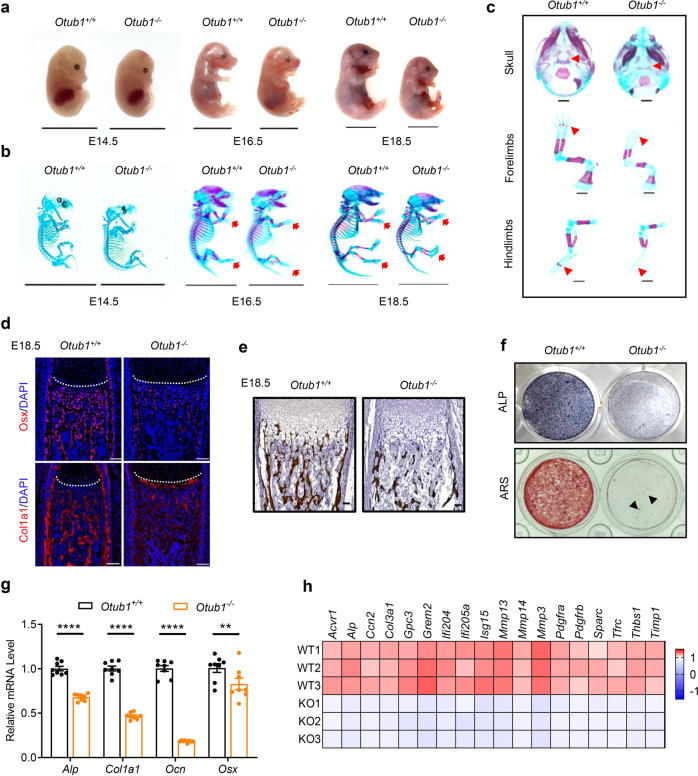
OTUB1 deficiency causes defects in osteogenesis. a Representative image of Otub1+/+ and Otub1−/− embryos at E14.5, E16.5, and E18.5. n = 4 per group. Scale bars, 1 cm. b Representative images of whole skeleton of Otub1+/+ and Otub1−/− embryos at E14.5, E16.5, and E18.5. Red arrows indicate the delayed Alizarin red staining in the ribs and phalanges. n = 4 per group. Scale bars, 1 cm. c Representative images of skeleton of skulls, forelimbs, and hindlimbs in E16.5 Otub1+/+ and Otub1−/− embryos. Red arrows indicate the delayed Alizarin red staining. n = 4 per group. Scale bars, 1 mm. d Immunofluorescence assay for expression of osteoblast differentiation markers Osx and Col1a1 in E18.5 Otub1+/+ and Otub1−/− femurs. n = 3 per group. Scale bars, 100 μm. White line indicates the epiphyseal growth plate. e Representative images of Von Kossa staining of E18.5 Otub1+/+ and Otub1−/− mice. n = 3 per group. Scale bars, 50 μm. f Representative images of ALP and ARS staining of osteoblast cells from E18.5 Otub1+/+ and Otub1−/− mice after cultured in osteogenic medium for 14 and 28 days. Black arrows indicate calcified nodules. g Quantitative RT-PCR analysis of osteogenesis genes mRNA levels in osteoblast cells from Otub1+/+ and Otub1−/− mice. n = 8 per group. h Gene expression profiles of the selected osteogenetic genes in osteoblast cells from Otub1+/+ (referred to as WT) and Otub1−/− (referred to as KO) mice. **p < 0.01, ****p < 0.0001. All data are shown as the mean ± SEM

