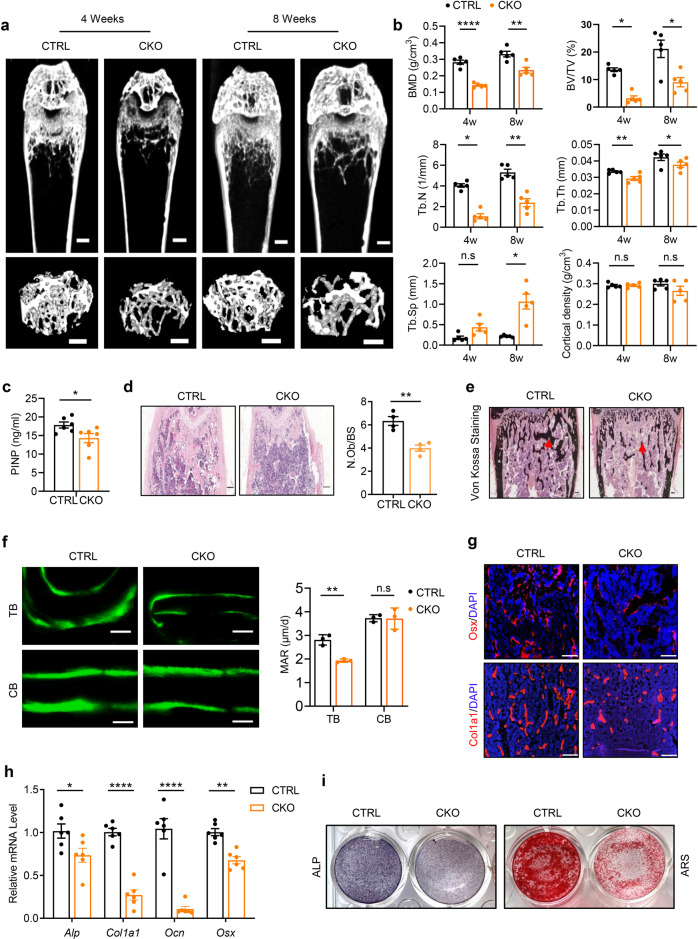
Fig. 2.
Inactivation of OTUB1 in osteoblast cells leads to bone mass loss. a Representative micro-CT images of whole femoral (top) and trabecular (bottom) bones from 4- and 8-week-old male OTUB1 CTRL and CKO mice. n = 5 per group. Scale bars, 0.5 mm. b Histomorphometric analysis of trabecular bones from (a), including bone mass density (BMD), bone volume per tissue volume (BV/TV), trabecular thickness (Tb.Th), trabecular number (Tb.N), trabecular spacing (Tb.Sp) and cortical density. n = 5 per group. c Serum levels of procollagen type 1 amino-terminal propeptide (P1NP) from 8-week-old male OTUB1 CTRL and CKO mice. n = 6 per group. d H&E staining and quantitative analysis of osteoblast numbers (N.Ob/BS) in femurs from 8-week-old male Otub1 CTRL and CKO mice. n = 4 per group. Scale bar, 100 μm. e Representative images of Von Kossa staining of femurs from 8-week-old male OTUB1 CTRL and CKO mice. n = 3 per group. Scale bar, 100 μm. f Representative images of calcein double staining and quantitative analysis of mineralization apposition rate (MAR) of the trabecular bones (TB) and cortical bones (CB) from 8-week-old male OTUB1 CTRL and CKO mice. n = 3 per group. Scale bar, 20 μm. g Immunofluorescence assay for expression of osteoblast-differentiation-related marker genes, including Osx and Col1a1 in OTUB1 CTRL and CKO mice. n = 3 per group. Scale bars, 200 μm. h Quantitative RT-PCR analysis of osteogenesis genes mRNA levels in 8-week-old male OTUB1 CTRL and CKO mice. n = 6 per group. i Representative images of ALP and ARS staining of BMSCs from OTUB1 CTRL and CKO mice after cultured in osteogenic medium for 14 and 28 days. *p < 0.05, **p < 0.01, ****p < 0.0001, n.s., not significant. All data are shown as the mean ± SEM

