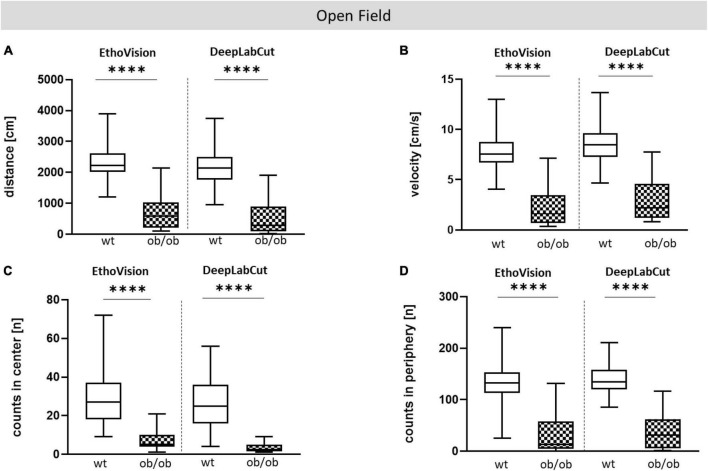
FIGURE 5.
Comparative analysis with EV and DLC for OF test. OF analysis of wt and ob/ob mice. (A) Moved distance (cm), (B) mean velocity (cm/s), (C) number of visits (counts) in center (n), (D) number of visits (counts) in periphery (n). Significance of differences between the groups were tested by unpaired Student’s t-test. Group size was as follows: n(wt) = 36(EV) or 35(DLC), n(ob/ob) = 40 [EV (A,B,D)] and 39 (C) or 38 [DLC (A,B,D)] and 34 (C). Statistical significance was set at ****p < 0.0001. EV, EthoVision; DLC, DeepLabCut.

