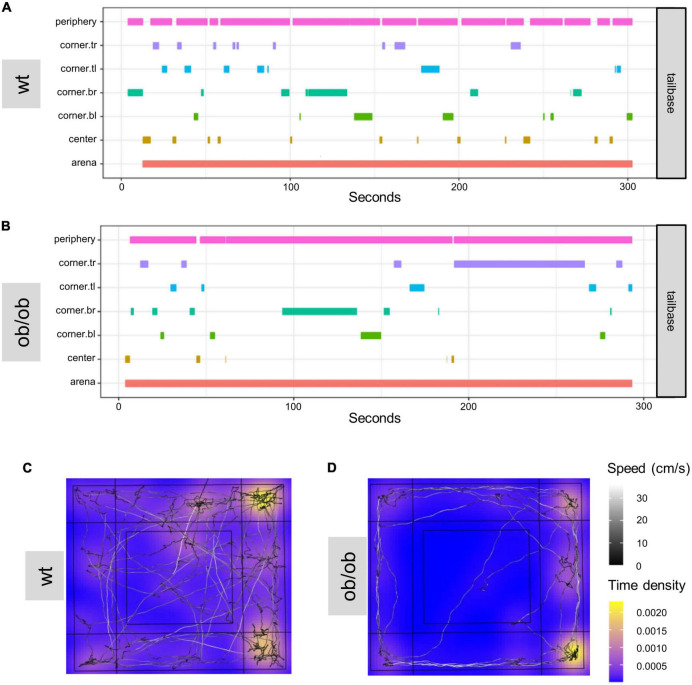
FIGURE 7.
DeepLabCut (DLC) tracking results analyzed with customized R-script based on DLC-Analyzer. Example of a zone-visit-plot of a wild type [(A) wt] and an ob/ob (B) mouse in OF. The individual zones show how much time the body part of interest (Supplementary Figure 2 for labeling of animals in DLC) was tracked in the predefined zones. Heat-maps of the OF test of wild type [wt (C)], and transgene leptin deficient [ob/ob (D)] mice. tl, top left; tr, top right; bl, bottom left, br, bottom right.

