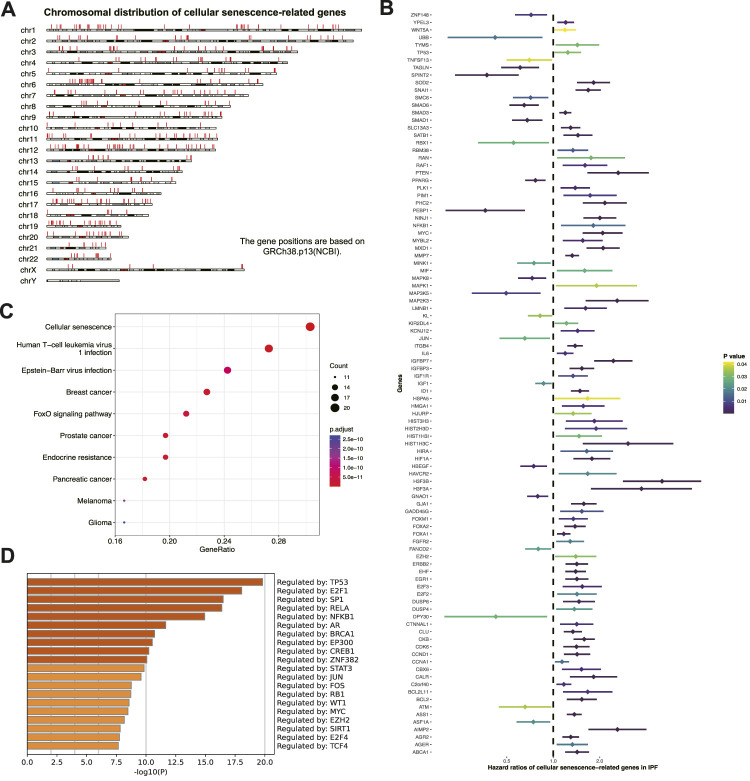
FIGURE 2.
Screening prognostic cellular senescence-related genes in IPF. (A) Chromosomal distribution of cellular senescence-related genes in IPF. Each red line represents a gene. (B) Forest maps of single factor survival analysis of cellular senescence-related genes of IPF. (C) KEGG enrichment analysis of prognostic cellular senescence-related genes. Dot size corresponds to the count of genes in each pathway. (D) TRRUST enrichment analysis of prognostic cellular senescence-related genes.

