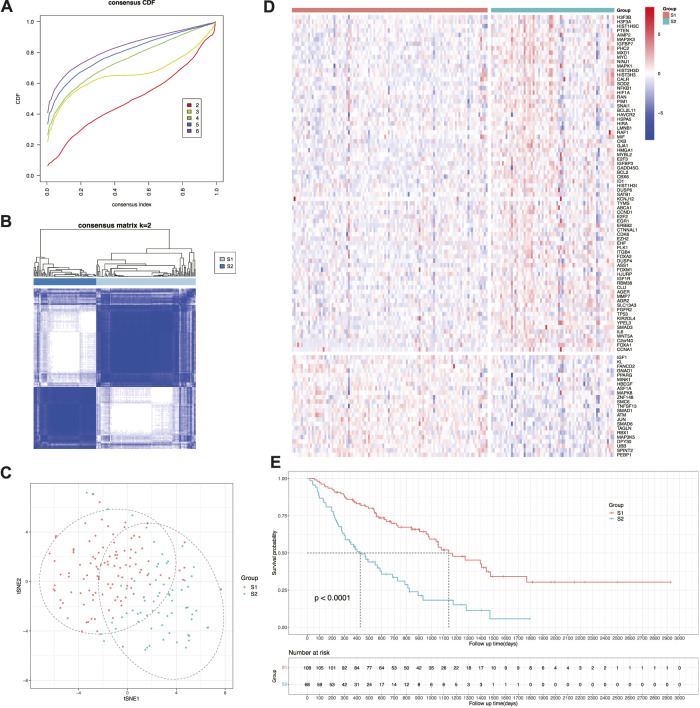
FIGURE 3.
Identification of cellular senescence-related subtypes of IPF. (A) Cumulative distribution function curve. (B) Sample clustering heatmap. (C) t-SNE distribution of two subtypes. (D) Heatmap of two subtypes based on prognostic cellular senescence-related genes. (E) Kaplan-Meier curves showing overall survival of two subtypes.

