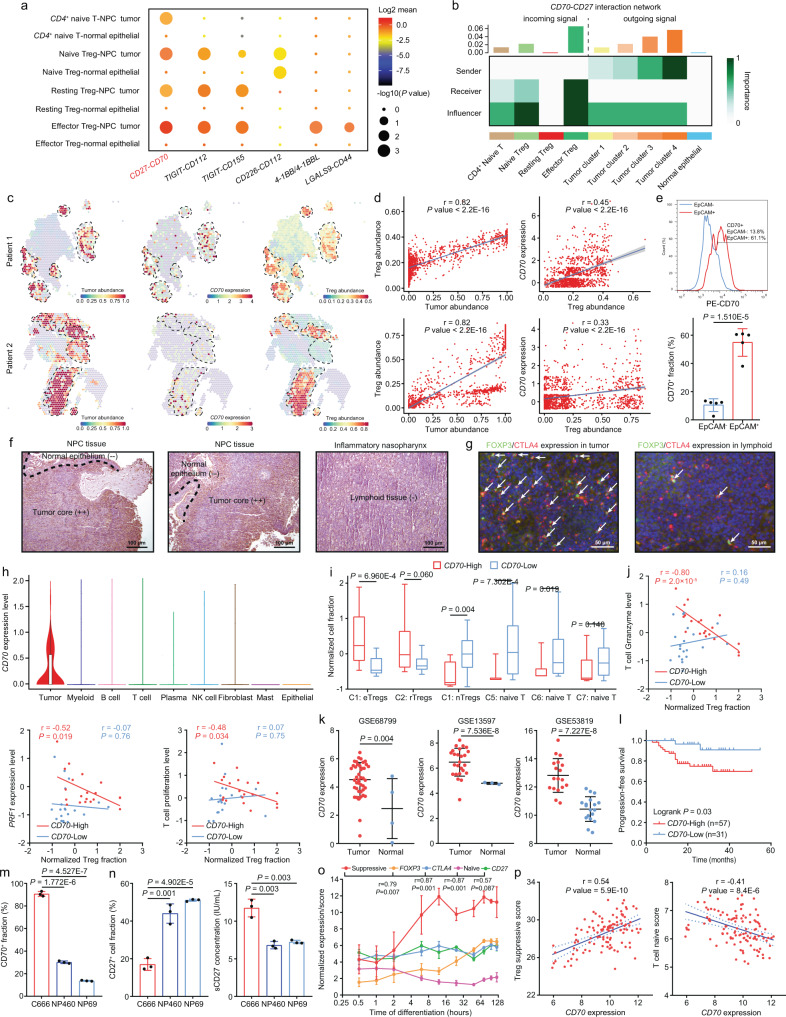
Fig. 2. CD70 + NPC cells contribute to abundant and suppressive Treg infiltration by interacting with CD4+/CD27+ T cells.
a CellPhoneDB revealed enriched ligand-receptor pairs among CD4+ naïve T cells, Tregs, NPC, and NPE cells (two-sided permutation test). b CellChat revealed NPC cells as the sender of CD70-CD27 signaling to CD4+ naïve T cells and Tregs. c Spatial co-localization of NPC cells, Tregs, and CD70 (n = 1089 and 1331). d The Pearson correlation (two-sided) between NPC cells/CD70 expression and Tregs (n = 1089 and 1331). e The CD70+ fractions in EPCAM + NPC cells and EPCAM- cells from NPC biopsies (n = 5, two-sided unpaired t test).IHC (f) and IF staining (g) showed CD70, FOXP3, and CTLA4 expression in NPC, normal epithelium and lymphoid tissues. h Expression of CD70 across cell lineages. i Normalized fractions of Treg and CD4+ naïve subtypes in CD70-high (n = 20) and CD70-low patients (tumor n = 16, normal n = 4) from scRNA-seq data (two-sided unpaired t-test). j The Pearson correlation (two-sided) between the normalized Treg fraction and average expression of granzymes, PRF1, and T-cell proliferation markers in CD70-high (n = 20) and CD70-low patients (tumor n = 16, normal n = 4) from scRNA-seq data. k Normalized CD70 expression in three NPC RNA-seq cohorts. Left: GSE68799 (tumor n = 42, normal n = 3); Middle: GSE13597 (tumor n = 25, normal n = 3); Right: GSE53819 (tumor n = 18, normal n = 18) (two-sided unpaired t test). l The progression-free survival for NPC patients from GSE102349 (high n = 57, low n = 31, two-sided log-rank test). m The fraction of CD70+ cells in C666 cells versus in NP460 or NP69 cells (n = 3, two-sided unpaired t test). n Changes of surface and sCD27 in co-culture systems with C666 versus with NP460 or NP69 cells (n = 3, two-sided unpaired t test). o The change of Treg suppressive and T naïve scores and signatures during induced Treg differentiation (n = 3, two-sided Pearson correlation analysis). p The Pearson correlation (two-sided) between the Treg/T naïve scores and CD70 expression in GSE102349 (n = 112). The n number represents n biologically independent spots/samples/experiments in each group. The data are presented as the mean ± SD (bar plots), median ± IQR (whiskers = 1.5 × IQR, box & whiskers plots), and KDE (violin plots).

