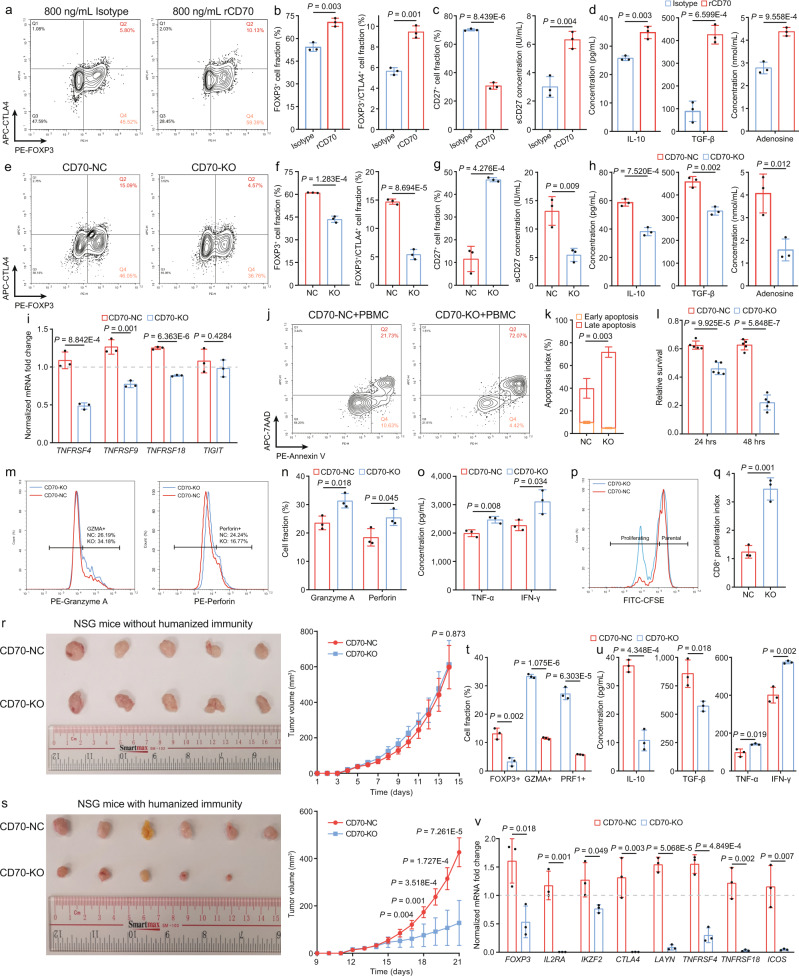
Fig. 3. Genetic ablation of CD70 in NPC cells reverts Treg suppressive activity and enhances CD8+ T cell function in the TME.
a, b Immunophenotyping of CD4+ naïve T cells treated with IgG antibody and recombinant CD70 antibody (rCD70, n = 3, two-sided unpaired t test). c Changes of surface and sCD27 in the co-cultured systems treated with IgG antibody and rCD70 (n = 3, two-sided unpaired t test). d The change of immunosuppressive factors in the IgG-treated and rCD70-treated co-culture systems (n = 3, two-sided unpaired t test). e, f Immunophenotyping of CD4+ naïve T cells co-cultured with CD70-NC and CD70-KO C666 cells (n = 3, two-sided unpaired t test). g Changes of surface and sCD27 in the co-cultured systems with CD70-NC and CD70-KO C666 cells (n = 3, two-sided unpaired t test). h The change of immunosuppressive factors in the CD70-NC and CD70-KO co-culture systems (n = 3, two-sided unpaired t test). i The normalized mRNA fold change of Treg activation-specific markers in CD4+ naïve T cells co-cultured with CD70-NC and CD70-KO C666 cells (n = 3, two-sided unpaired t test).T-cell cytotoxicity measured in the CD70-NC and CD70-KO (j and k, flow cytometry, n = 3; l, XTT assay, n = 5) PBMC co-culture systems (two-sided unpaired t test). The change of CD8+ T-cell cytotoxicity markers (m and n, flow cytometry), cytokines (o, ELISA) and proliferation (p and q, CFSE) in the CD70-NC and CD70-KO PBMC co-culture systems (n = 3, two-sided unpaired t test). (r, s) The CD70-NC and CD70-KO tumor growth (r, n = 5 for NSG mice; s, n = 6 for humanized mice) in immunodeficient NSG and PBMC-engrafted humanized mice (two-sided unpaired t test). The change of immunosuppressive and cytotoxic T cell subtypes (t, flow cytometry), cytokines (u, ELISA), and markers (v, qRT-PCR) in CD70-NC and CD70-KO tumors (n = 3, two-sided unpaired t-test). The n number represents n biologically independent samples/experiments in each group. The data are presented as the mean ± SD (bar plots).

