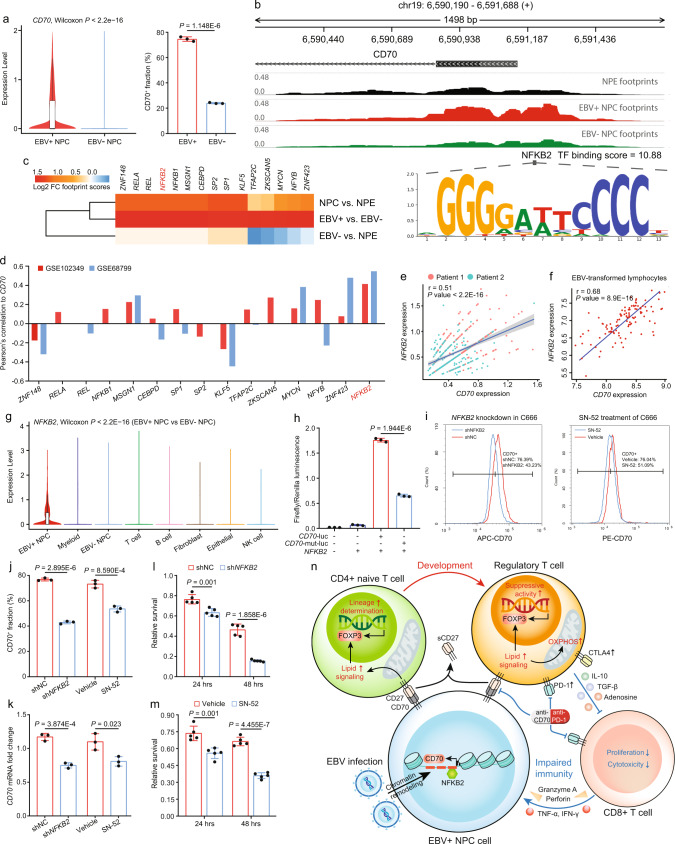
Fig. 7. EBV infection increases chromatin accessibility at the CD70 promoter and promotes CD70 transcription via NFKB2.
a Left, the single-cell expression of CD70 in EBV+ and EBV- NPC cells (tumor sample n = 36, two-sided Wilcoxon signed-rank test); Right, the quantified CD70+ cell fractions in EBV+ and EBV- NPC43 cells (n = 3, two-sided unpaired t test). b The chromatin accessibility measured by ATAC-seq at the CD70 promoter in EBV+, EBV- NPC cells, and NPE cells. c Top 15 enriched TFs with the highest transcriptional activity in EBV+ NPC cells. d The Pearson correlation (two-sided) between each TF and CD70 in GSE102349 (n = 112) and GSE68799 (n = 42) cohorts. e The spatial co-localization of NFKB2 and CD70 expression in down-sampled spatial spots (n = 100, two-sided Pearson correlation analysis with the 95% confidence band). f The Pearson correlation (two-sided) between NFKB2 and CD70 expression in EBV-transformed lymphocytes (n = 107, with the 95% confidence band). g Expression of NFKB2 across major cell lineages in the NPC scRNA-seq cohort (n = 50, two-sided Wilcoxon signed-rank test). h Relative firefly luminescence normalized by renilla luminescence in each experimental group (n = 3, two-sided unpaired t test). i, j The change of CD70 + fraction in shNC, shNFKB2, vehicle-treated, and SN-52-treated C666 cells (n = 3, two-sided unpaired t test). k The 18s-normalized mRNA fold change of CD70 in shNC, shNFKB2, vehicle-treated, and SN-52-treated C666 cells (n = 3, two-sided unpaired t test). l T-cell cytotoxicity measured in the shNC and shNFKB2 PBMC co-culture systems (n = 5, two-sided unpaired t test). m T-cell cytotoxicity measured in PBMCs co-cultured with vehicle and SN-52-treated C666 cells (n = 5, two-sided unpaired t test). n The schematic illustration of the molecular mechanism of the EBV-NFKB2-CD70-CD27 signaling axis and feedback loop between NPC cells, CD4+ naïve T cells/Tregs, and CD8+ T cells in the NPC microenvironment. The n number represents n biologically independent spots/samples/experiments in each group. The data are presented as the mean ± SD (bar plots), median ± IQR (whiskers = 1.5 × IQR, box & whiskers plots), and KDE (violin plots).

