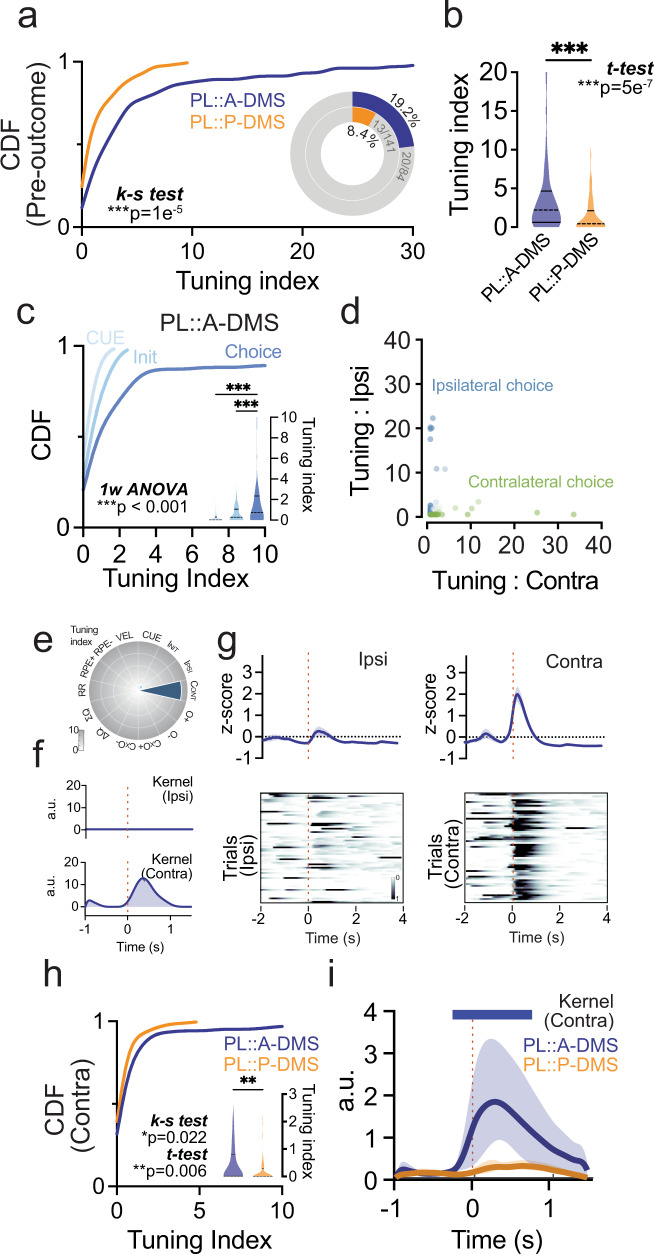
Fig. 5. Pre-outcome tuning is dominated by preferential encoding of choice in PL::A-DMS.
a Comparison of cumulative distribution of pre-outcome group tuning (p = 1e−5, Two-sided Kolmogorov-Smirnov test) and the proportion of highly tuned neurons to pre-outcome group predictor (insets, >5% tuning index). ***p < 0.001. b Comparison of average tuning index(Shaded area, Kernel probability density; solid line, quartile=0.4965,4.571/0,2.028; dotted line, median = 2.211/0.4421) between PL::A- or P-DMS for pre-outcome predictors. (p = 5e−7, PL::A-DMS, n = 104 cells; PL::P-DMS, n = 154 cells, Two-sided unpaired t-test). ***p < 0.001. c Comparison of cumulative distributions of individual components for pre-outcome group predictors from PL::A-DMS and average tuning index (insets; Shaded area, Kernel probability density; solid line, quartile; dotted line = 0.0.2959/0,1.057/0.2.334, median = 0/0.2718/0.7517; n = 104 cells, CUE-Init, p = 0.86; CUE-Choice, p = 8e−6; Init-Choice, p = 2e−7, Šidák multiple comparison test). ***p < 0.001. d Scatter plot of Ipsi/Contra tuning index from task tuned neurons (green: Contra- encoding neurons, blue: Ipsi-encoding neurons). e Tuning plot showing representative contralateral choice tuned neuron from PL::A-DMS. f Encoding model inferred kernels corresponding to ipsi (top) and contra (bottom) choice. g PETH (top) and trial-by-trial neuronal activity (bottom) aligned by Ipsi (left)/Contra (right) choice. Solid line, mean; shaded area, ±SEM. h Comparison of cumulative distribution(p = 0.022, Two-sided Kolmogorov-Smirnov test) and average tuning index (insets; Shaded area, Kernel probability density; solid line, quartile = 0.0.7890/0,0.3020; dotted line, median = 0.0101/0) of contra choice tuned neurons in both PL::A/P-DMS pathways (p = 0.006, PL::A-DMS, n = 104 cells; PL::P-DMS, n = 154 cells, Two-sided unpaired t-test). **p < 0.01. i Comparison of model inferred contralateral choice kernels on average for both PL::DMS pathways. Solid line, root-mean-squared (RMS); shaded area, ±95% confidence interval. Colored bar on top indicates timepoints for which RMS kernels are significantly different between pathways (bootstrap test).

