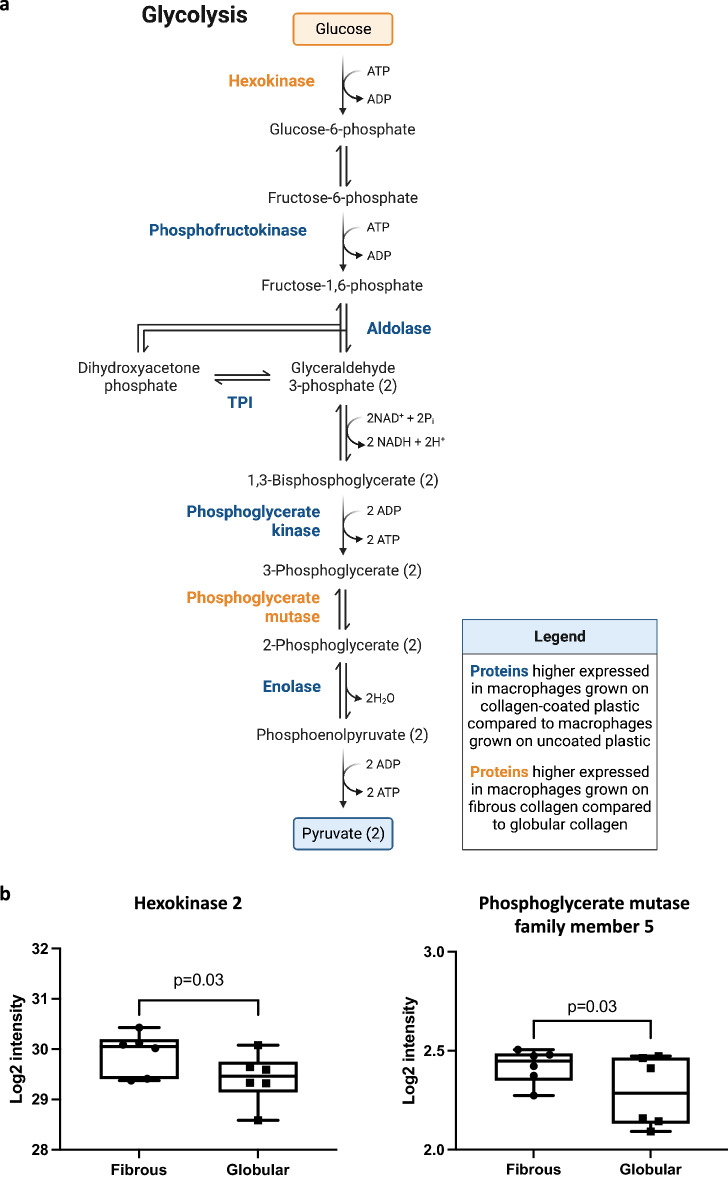
Figure 3.
Glycolytic enzymes that were differentially expressed between macrophages cultured on fibrous or globular collagen. (a) Glycolysis metabolic pathway. Five proteins of the glycolysis pathway were significantly higher expressed in macrophages grown on collagen-coated plastic (fibrous and globular pooled, n = 6 each) compared to macrophages grown on uncoated plastic are indicated in blue. Proteins of the glycolysis pathway that were significantly higher expressed in macrophages grown on fibrous collagen compared to globular collagen are indicated in orange (fold change < 0.875 or > 1.25). (b) Two proteins of the glycolysis pathway were significantly higher expressed in macrophages grown on fibrous collagen compared to macrophages grown on globular collagen. Data are expressed as normalized Log2 values and statistically tested with a paired Wilcoxon test and p < 0.05 was considered significant (n = 6). Data represented as a box and whiskers plot, where the box extends from the 25th to 75th percentiles and whiskers from min to max values.

