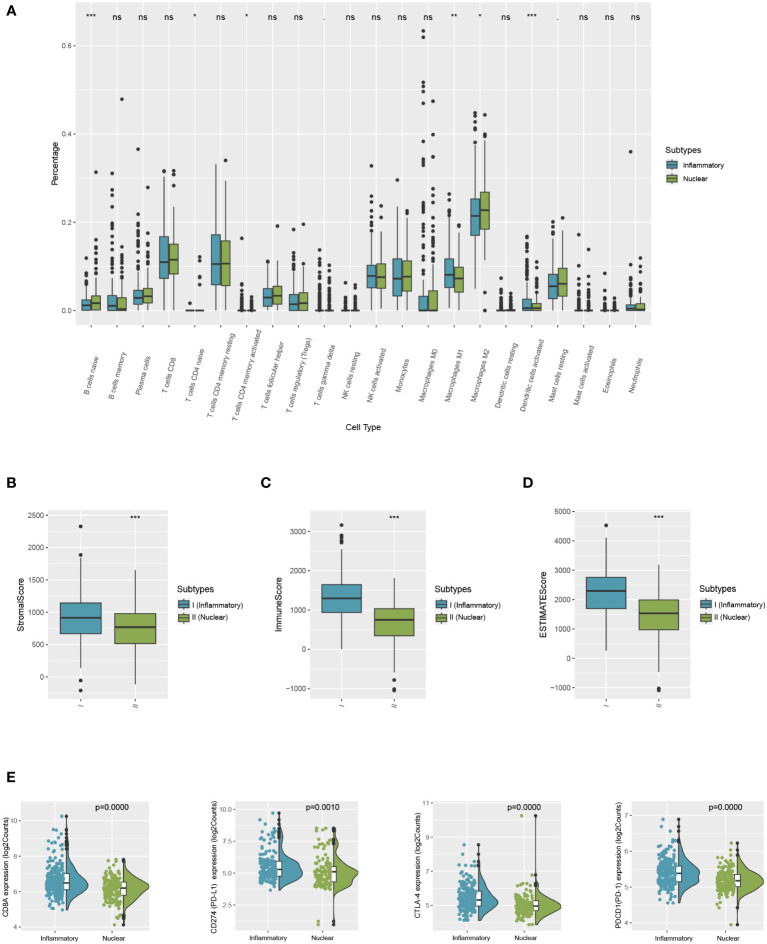
Figure 5.
Comparison of differences between two subtypes in immune microenvironment status and immune signature expression levels. (A) The differential estimated proportion of 22 CIBERSORT immune cell types in DAMPs-associated subtypes. The central line represents the median value. The bottom and top of the boxes are the 25th and 75th percentiles (interquartile range). (B) Stromal score in DAMPs-associated subtypes. (C) Immune score in DAMPs-associated subtypes. (D) ESTIMATE score difference between the two subtypes in the training cohort. (E) Expression differences in CD8A, PD-1, PD-L1 and CTLA4 between two subtypes. *P < 0.05; **P < 0.01; ***P < 0.001; ns, not significant.

