Figure 12.
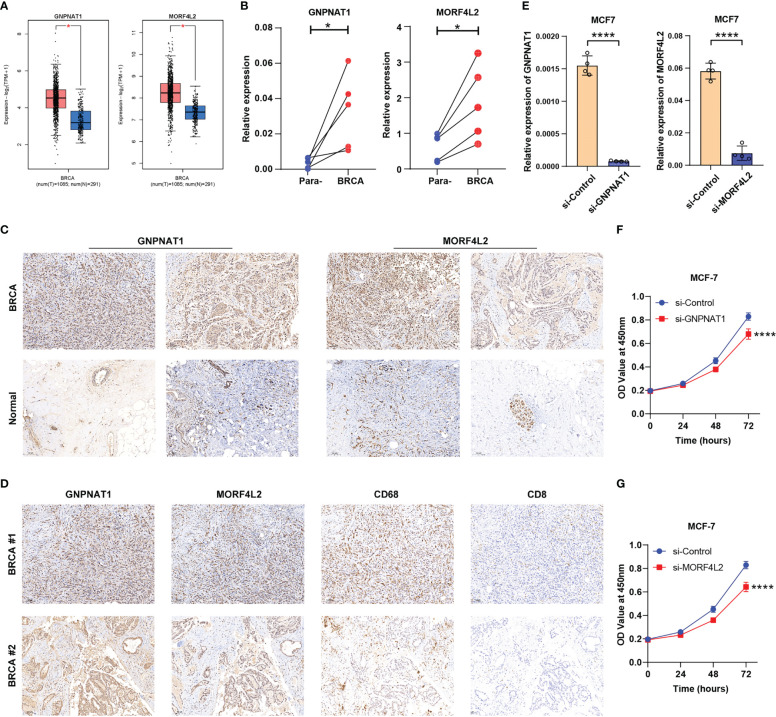
Expression validation and functional exploration of two key DRGs. (A) GEPIA database analyses demonstrated the differential expression of GNPNAT1 and MORF4L2 in BRCA and normal breast tissues. (B, C) RT-qPCR and IHC (10×) experiments showed the elevated expression of GNPNAT1 and MORF4L2 in BRCA tissues compared with adjacent normal tissues. (D) IHC assays (10×) revealed the association of key DRGs with macrophages and CD8+ T cells. (E) The expression of GNPNAT1 and MORF4L2 was knocked down in the targeted group. (F, G) Knockdown of either GNPNAT1 or MORF4L2 could suppress the proliferation activity of MCF-7 cells. (*P < 0.05, ****P < 0.0001).

