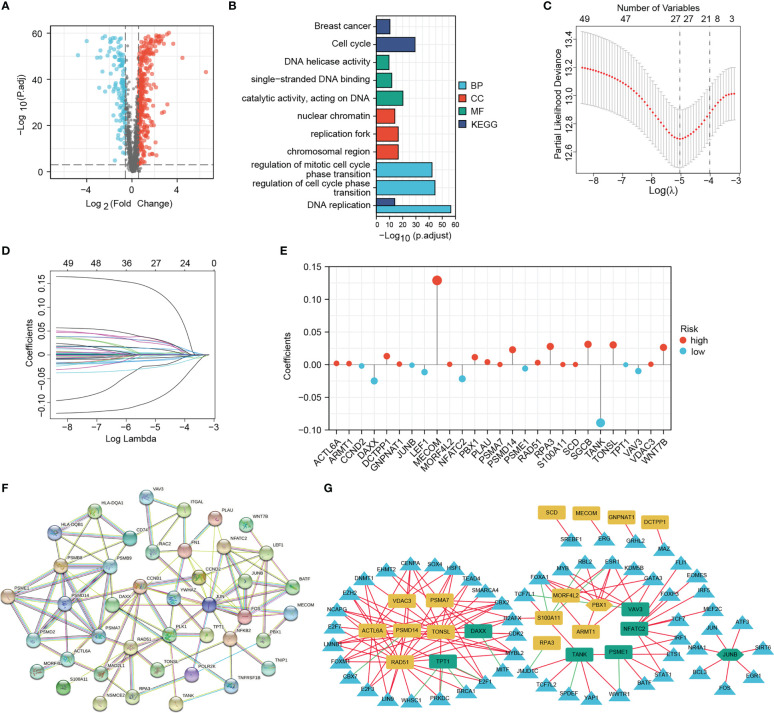
Figure 2.
Screening for differentially expressed DNA damage and repair-related genes (DRGs) for prognostic signature establishment. (A) Volcano map of the differentially expressed DRGs. (B) GO and KEGG enrichment results of differentially expressed DRGs. (C–E) LASSO analysis confirmed the candidate DRGs and their coefficients. (F) PPI network of prognostic DRGs. (G) Interaction network of signature DRGs and their related TFs; The red and green lines represent positive and negative correlations, respectively. The yellow and green graphs represent high-risk and low-risk MRGs, respectively. Triangles represent TFs. Two hexagons represent TFs that also act as signature DRGs.

