Figure 1.
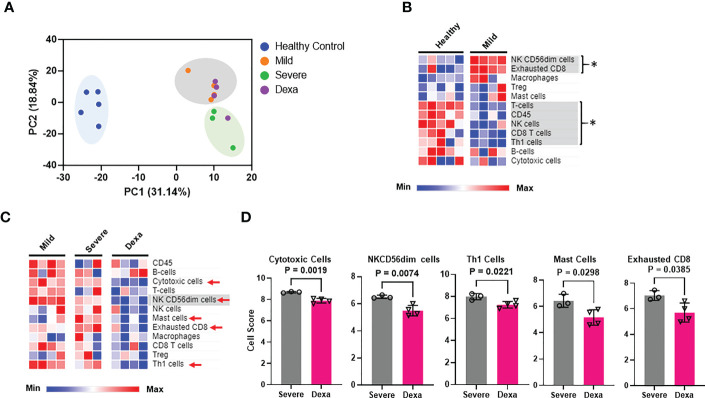
Immune cell profiling of PBMCs from healthy controls, mild and severe COVID-19 patients and severe COVID-19 patients treated with dexamethasone. (A) Principal components analysis (PCA) of NanoString transcriptomic data. (B) Heatmap depicting immune cell abundance in PBMCs from healthy donors (n=5) and mild COVID-19 patients (n=4). Significantly altered cell types are highlighted in gray and represented by *. (C) Heatmap depicting abundance of immune cell types in PBMCs from patients with mild (n=4), severe COVID-19 (Severe, n=3), and severe COVID-19 + dexamethasone (Dexa, n=4). Significantly altered cell types between mild and severe are highlighted in gray, and those altered between severe +/- dexamethasone are marked by red arrows. (D) Cell types significantly altered by dexamethasone treatment in severe COVID-19 patients. Bars represent means ± SD. In (A, D), each symbol represents an individual patient or healthy donor. Dexa = dexamethasone. Significance was determined by unpaired t-test and by Mann-Whitney rank sum test where samples failed normality. The abundance of the different immune cell types (at the RNA level) in the various patient cohorts was calculated as log2 cell type scores. The cell scores for a specific cell type can only be compared between two groups (such as mild vs. severe COVID-19) but do not support claims that a cell type is more abundant than another cell type within the same group.

