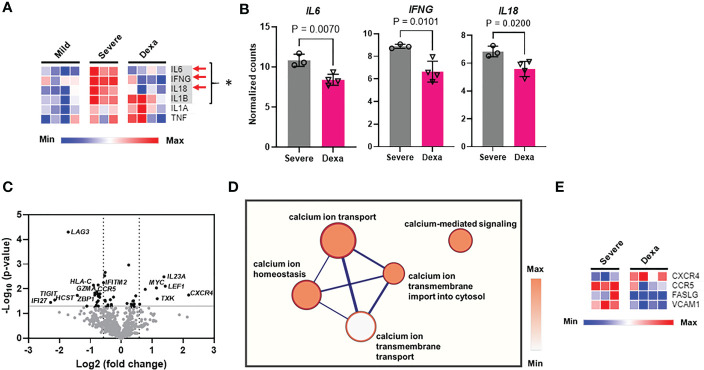
Figure 3.
Cytokine storm gene expression, differential gene expression, and calcium signaling pathways altered by dexamethasone in severe COVID-19. (A) Heatmap depicting expression levels (determined as normalized RNA counts by NanoString) of genes involved in cytokine storm production in PBMCs from patients with mild (n=4), severe COVID-19 (Severe, n=3), and severe COVID-19 treated with dexamethasone (Dexa, n=4). Significantly altered genes between mild and severe groups are highlighted in gray and represented by *, and those altered between severe +/- dexamethasone are marked by red arrows. (B) Cytokine storm genes significantly altered by dexamethasone treatment in severe COVID-19 patients. Bars represent means ± SD, and each symbol represents an individual. Significance in (A, B) was determined by unpaired t-test. (C) Volcano plot showing differentially expressed genes (P<0.05 with unpaired t test, -log10Pvalue > 1.3, fold change>1.5) altered by dexamethasone in severe COVID-19. Top differentially expressed genes are labeled. (D) Correlation network analysis for calcium signaling-related pathways that were decreased by dexamethasone in severe COVID-19. The cluster of nodes that represent the transmembrane calcium ion transport are grouped together in the outer rectangle. Thicker edges (blue lines) indicate the number of genes shared between the nodes, whereas the intensity of the node fill color indicates the enrichment of genes in that specific process. (E) Heatmap depicting expression levels (determined as normalized RNA counts by NanoString) of significantly altered genes, that were involved in the calcium signaling-related pathways (shown in Panel D) in PBMCs from patients with severe COVID-19 (Severe, n=3), and severe COVID-19 treated with dexamethasone (Dexa, n=4). Further details and p-values for these genes are presented in Table S5. Significance determined by unpaired t-test.

