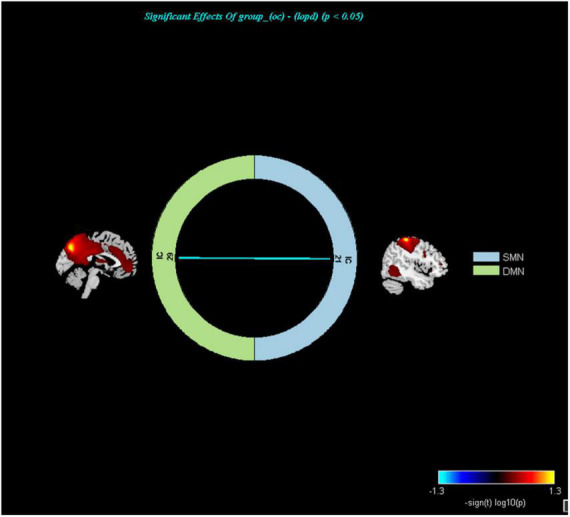
FIGURE 5.

Networks with altered inter-network functional connectivity between LOPD and OCs (P < 0.05, FDR corrected). Color represents functional connection strength. The cooler the color, the weaker the functional connection. SMN, sensorimotor network; DMN, default mode network.
