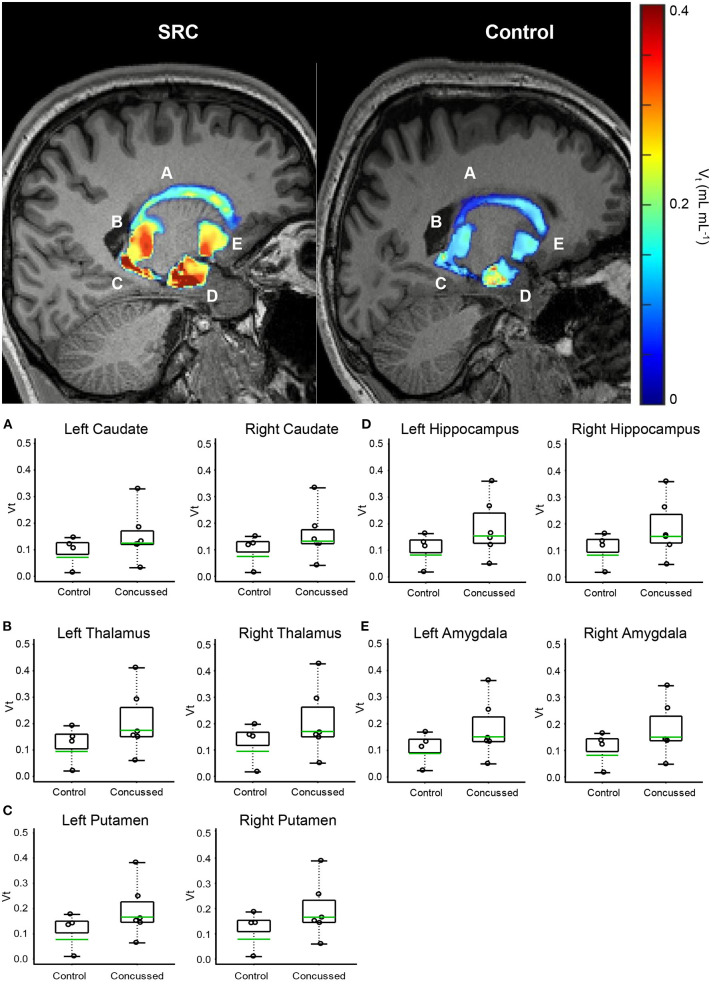
Figure 1.
Volumetric VT maps quantify persistent microglial activation in athletes diagnosed with SC (Group 1) who have achieved uRTP compared to controls (Group 2). (A) Caudate. (B) Thalamus. (C) Putamen. (D) Hippocampus. (E) Amygdala. Regional VT maps are computed (top) from a voxel-based parametric PET map. Geometric means (bottom-green line) of voxels within each CNS region are compared (bottom) between SC athletes and age- and genotype-matched healthy controls. Across 164 regions, the regions associated with consistent and significantly elevated microglial activation are the bilateral caudate, thalamus, putamen, hippocampus, and amygdala.

