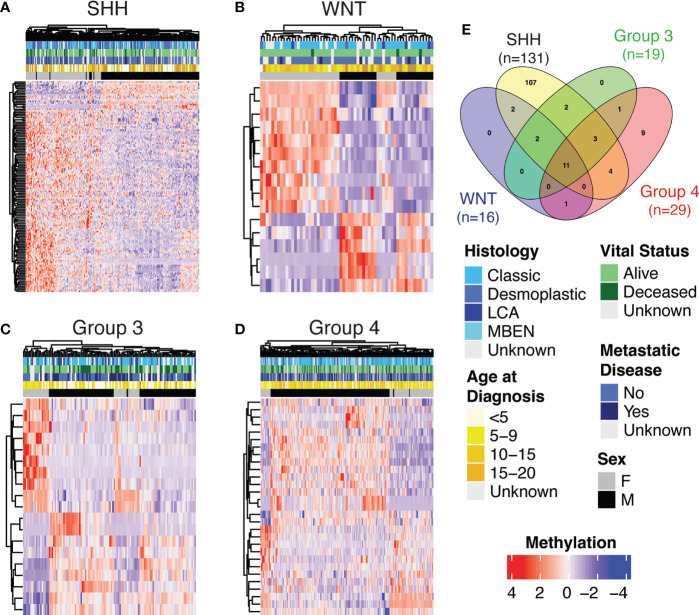
Figure 2.
Heatmap showing methylation levels (row-scaled β-values) of statistically significantly differentially methylated positions (DMPs) by sex (adjusted p<0.05) from the autosomes in Cavalli cohort within subgroup (A) SHH, (B) WNT, (C) Group 3 and (D) Group 4. (E) The number of genes that contained a DMP by sex for each subgroup and the overlap of those gene sets.

