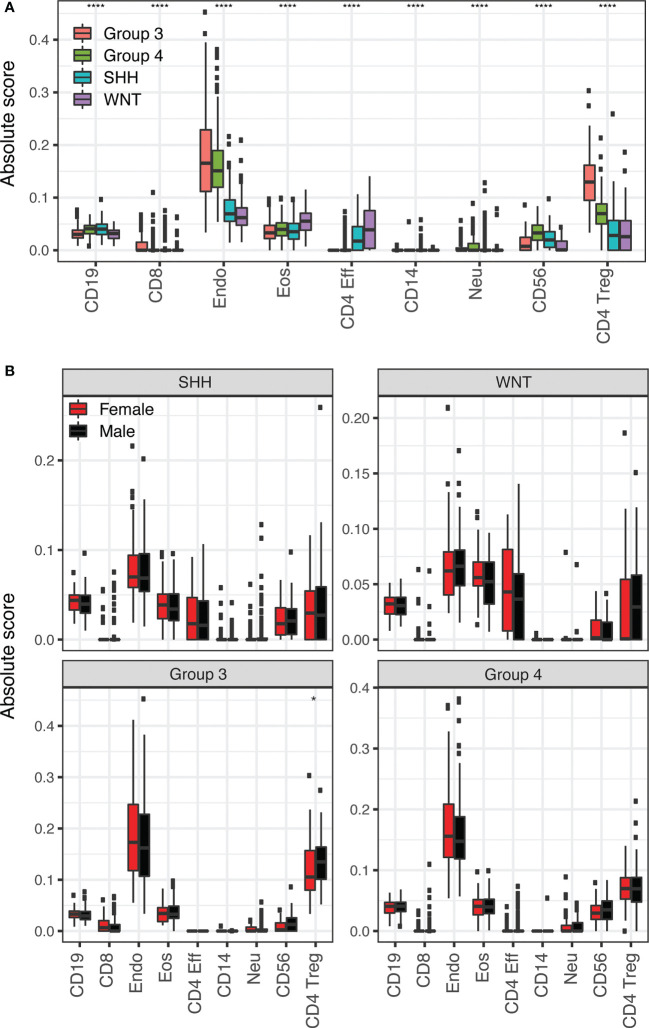
Figure 3.
(A) Application of the MethylCIBERSORT stromal signature matrix to deconvolution of 708 medulloblastoma 450K methylation arrays using CIBERSORT. Boxplots compare medulloblastoma subgroup means for each cell type. Significance is calculated using pairwise Wilcoxon Rank Sum test with p-values (*p <= 0.05; ****: p <= 0.0001). The symbol is shown for the highest significance between two different subgroups for each cell type. (B) Boxplots comparing female (red) and male (black) means for each cell type in each medulloblastoma subgroup as labeled.

