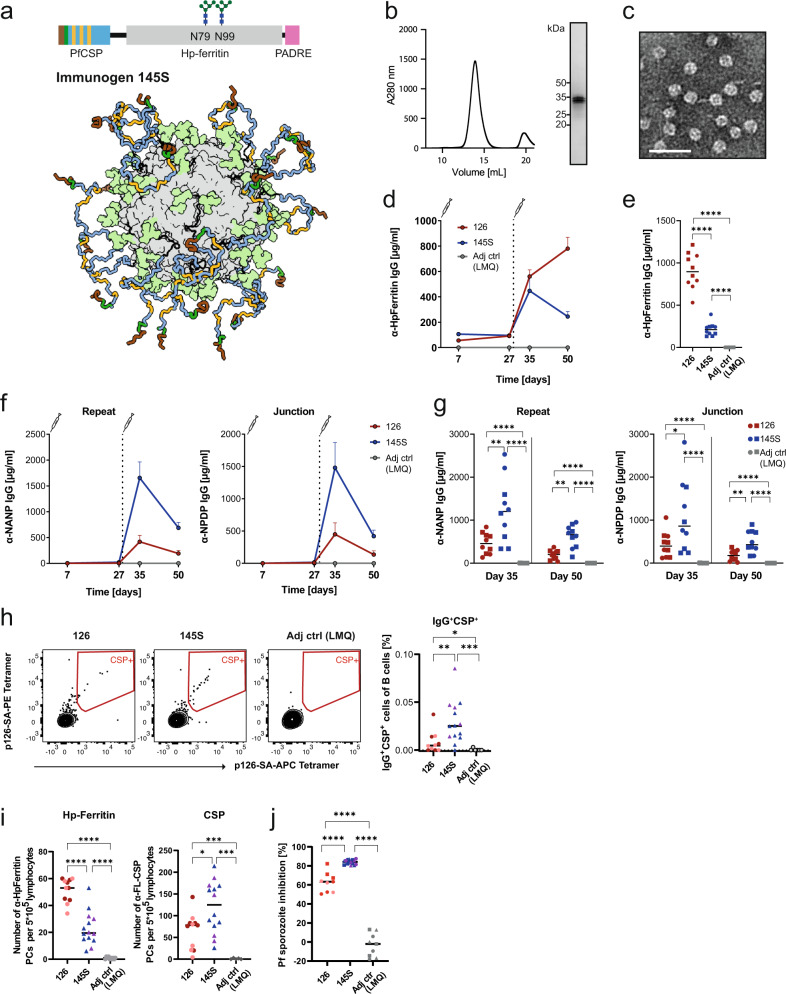
Fig. 3. Glycan modifications of the nanoparticle focus the humoral response on PfCSP epitopes.
a Schematic representation of immunogen 145S. Immunogen 126 (Fig. 2a) was modified by the engineering of two non-native N-linked glycosylation sites at positions N79 and N99 of H. pylori apoferritin. Expression of these nanoparticles in HEK293S (GnT I−/−) cells led to an addition of high mannose sugars at the targeted positions. This glycosylation (colored light green) covers the H. pylori apoferritin nanoparticle surface while not affecting presentation of the PfCSP epitope (scheme below). b Size exclusion chromatogram and SDS-PAGE analysis of immunogen 145S (uncropped SDS-PAGE in Supplementary Fig. 3b). c Negative stain electron microscopy of immunogen 145S. Scale bar—50 nm. d C57BL/6J mice were immunized with immunogen 126 or 145S adjuvanted with LMQ at day 0 and 28. The serum IgG response against H. pylori apoferritin was measured at various timepoints. Immunization with LMQ alone served as control. One representative out of two independent experiments with 5 mice per group is shown. e H. pylori apoferritin IgG response 22 days after the last immunization with immunogen 145S or 126 compared to adjuvant alone as negative control. Dots represent individual mice. Pooled data of two independent experiments with 5 mice per group are shown. Symbols indicate independent experiments. f Serum IgG response of the mice described in (d) against the PfCSP repeat (NANP) and the junction (NPDP). One representative out of two independent experiments with 5 mice per group is shown. g Comparison of the IgG response against the PfCSP repeat (NANP) and junction (NPDP) at 7 days and 22 days after the last immunization. Dots represent individual mice. Pooled data of two independent experiments with 5 mice per group are shown. Symbols indicate independent experiments. h Representative FACS analysis (left) and quantification (right) of live IgG+ antigen-binding cells in lymph nodes of mice immunized with immunogen 126, 145S or adjuvant alone 22 days after the last immunization. Dots represent individual mice. Pooled data of two independent experiments are shown. Symbols indicate independent experiments. Dark red (n = 6) and blue (n = 9): 10 µg dose immunization; light red (n = 5) and violet (n = 5): 0.5 µg dose immunization; adjuvant control group (n = 5). Detailed gating strategy is shown in Supplementary Fig. 9. i ELISpot-based enumeration of H. pylori apoferritin and FL-CSP reactive bone marrow plasma cells (PCs) of mice 22 days after the last immunization with immunogen 145S or 126 at 10 µg (dark red (n = 6) and blue (n = 9), respectively) or 0.5 µg (light red (n = 5) and violet (n = 5), respectively) or adjuvant alone (n = 10). Dots represent individual mice. Pooled data of two independent experiments are shown. Symbols indicate independent experiments. j Capacity of pooled sera (diluted 1:800, collected 22 days after the last immunization) from the same mice as in (i) to inhibit the hepatocyte traversal activity of Pf sporozoites in vitro. Pooled data of three independent traversal assay experiments are shown. Dark red (n = 6) and blue (n = 9): 10 µg dose; light red (n = 6) and violet (n = 6): 0.5 µg dose; adjuvant control group (n = 9). Symbols indicate independent immunization experiments. Arithmetic mean (d–j) and SEM (d, f) are indicated. Statistically significant differences were calculated by two-tailed Mann–Whitney test (*P < 0.05; **P < 0.01; ***P < 0.001, ****P < 0.0001).

