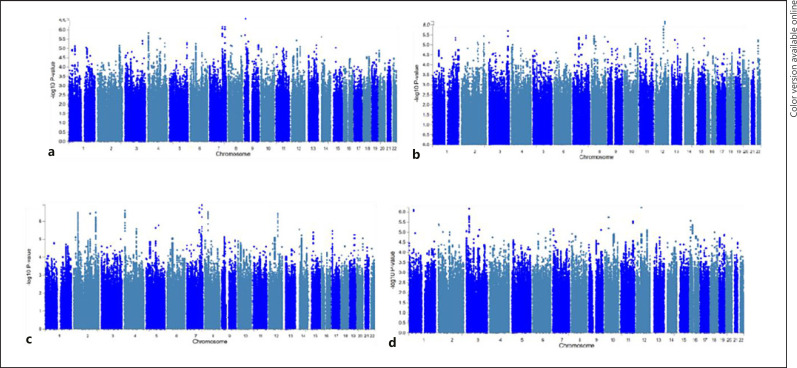
Fig. 5.
Manhattan plots for genome-wide association discovery across the three predictive models (a is LASSO, b is ridge, and c is the Shen et al. procedure) and measured IQ (d) in the same individuals from the 13SK sample. p values of each SNP are organized by chromosome on the x-axis and by the −log10 of the p value on the y-axis. No p values were significant below genome-wide discovery correction (p < 5e−8).

