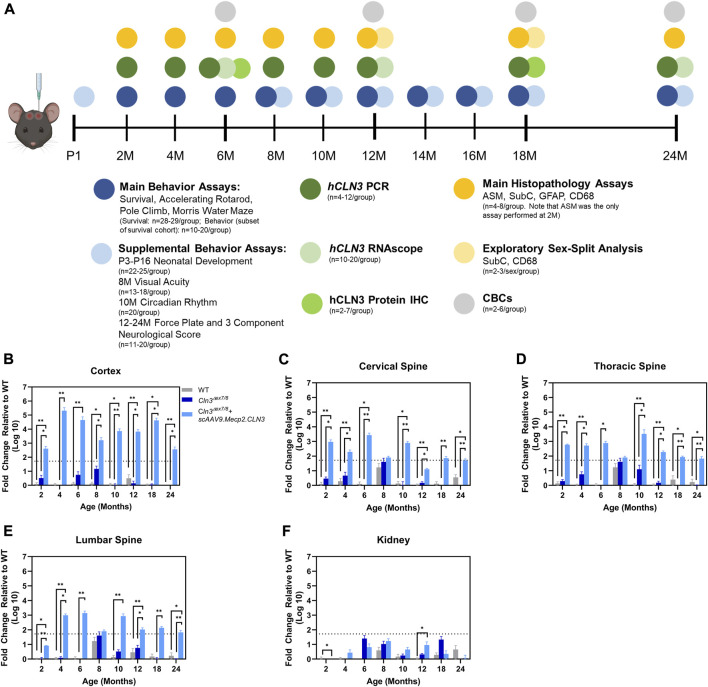
FIGURE 1.
Overall study design and demonstration of scAAV9.Mecp2.CLN3 administration resulting in hCLN3 expression throughout the brain and spinal cord. Overall study design (A). N’s represent mixed and even sexes unless otherwise described. As measured by RT-qPCR, hCLN3 is expressed in the cerebral cortex (B), cervical (C), thoracic (D), and lumbar (E) spinal cord. hCLN3 does not show strong expression in the kidney (F). Kruskal-Wallis, Dunn correction at each time point, as each time point was processed independently. Mean ± SEM. *p < 0.05, **p < 0.01, ***p < 0.001, ****p < 0.0001. For A, mouse graphic obtained from BioRender.com.

